Time-Based Visualization with lc_days_of_week_*, lc_days_of_month_*
These are prefixes used for the IDs of SVG elements that need to display time-based data visualization in different temporal formats, ideal for showing activity patterns, performance metrics, and temporal trends across different time scales.
Time-Based Chart Types
Cast supports two types of time-based chart visualizations with different data formats:
- hoursweek (
lc_days_of_week_*): Weekly visualization using different dates across the week (e.g., 2025-07-20, 2025-07-19, 2025-07-26) - hoursmonth (
lc_days_of_month_*): Monthly visualization using different dates across the month (e.g., 2025-07-20, 2025-07-19, 2025-07-26)
Data Format Differences
- Weekly/Monthly format: Different dates with timestamps for patterns across days/weeks/months
Use Cases
- Activity patterns and usage analytics over time
- Performance monitoring across different time periods
- Temporal data analysis and trend identification
- Time-based business intelligence and reporting
- User engagement patterns and behavioral analysis
- Operational metrics and system monitoring
- Daily, weekly, and monthly performance tracking
Element Identification
The target element must be a <rect> with an ID that starts with one of:
lc_days_of_week_*for weekly hour visualizationslc_days_of_month_*for monthly day visualizations
Input Format
The input value must be provided as a JSON array of objects with the following structure:
Note: While the JSON structure is the same for both chart types, the data format is consistent:
lc_days_of_week_*andlc_days_of_month_*use the same format with different dates (e.g., 2025-07-20, 2025-07-19, 2025-07-26)
JSON Format
A JSON string containing an array of objects with the following structure:
[
  {
    "value": "25",
    "name": "2025-07-01T06:00:00",
    "title": "Early Morning",
    "chartColor": "yellow"
  },
  {
    "value": "60",
    "name": "2025-07-01T07:00:00",
    "title": "Morning Rush"
  },
  {
    "value": "35",
    "name": "2025-07-01T08:00:00",
    "title": "Early Morning"
  },
  {
    "value": "80",
    "name": "2025-07-01T09:00:00"
  }
]
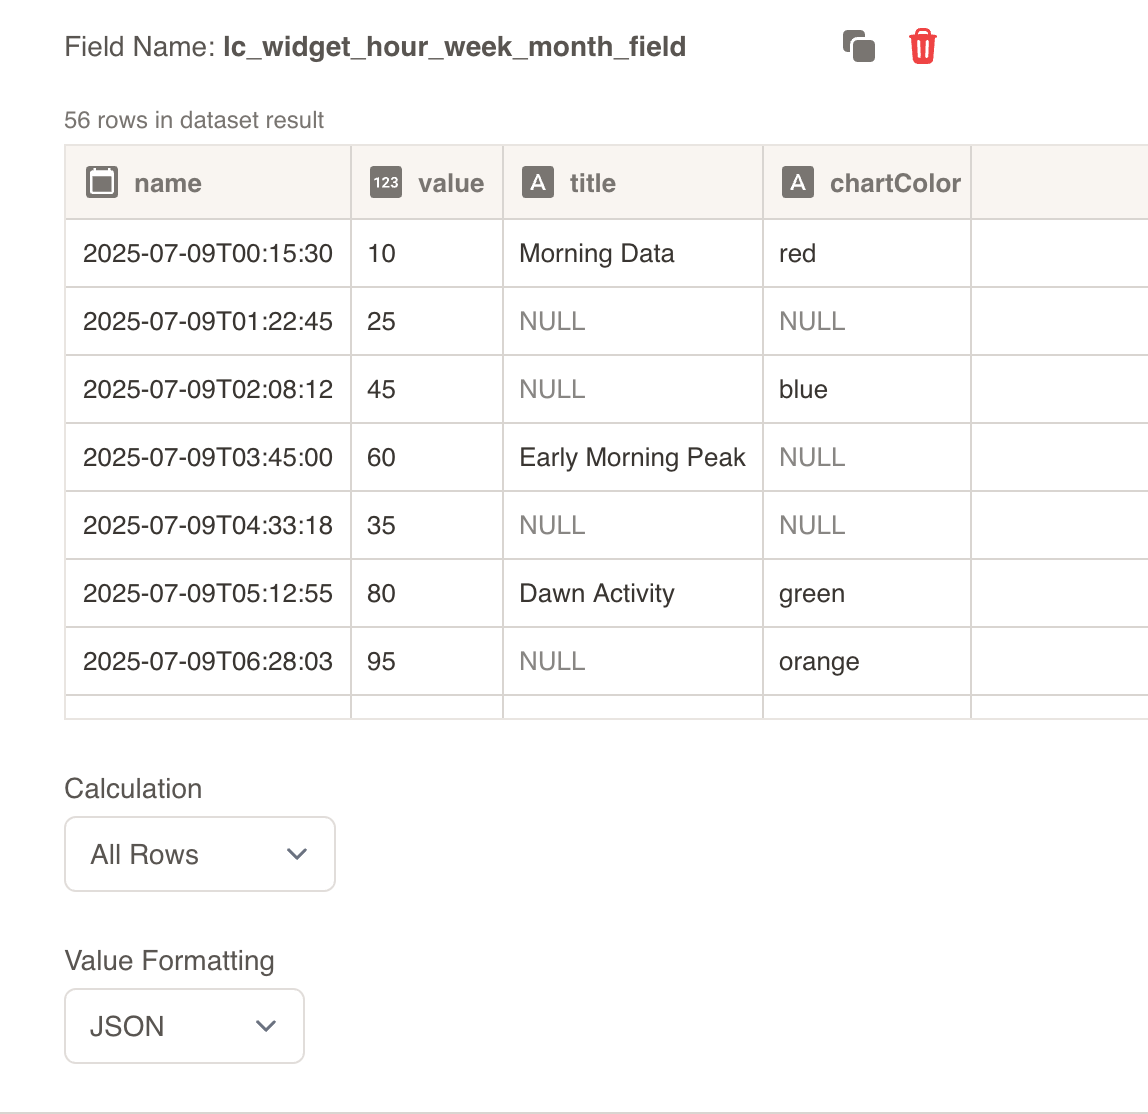
Dataset/CSV Format
Alternatively, you can use tabular data from your datasets with the following columns:
| name | value | title | chartColor | labelColor |
|---|---|---|---|---|
| 2025-07-01T06:00:00 | 25 | Early Morning | yellow | #333333 |
| 2025-07-01T07:00:00 | 60 | Morning Rush | blue | - |
| 2025-07-01T08:00:00 | 35 | Early Morning | - | - |
| 2025-07-01T09:00:00 | 80 | Dawn Activity | green | - |
| 2025-07-01T10:00:00 | 95 | - | orange | - |
Download Sample Data - Hour Week Month
Additional columns for specific widget types:
color: Individual element colors (lc_days_of_month only)
Dataset Usage:
- Connect your time-based chart to a dataset containing the required columns
- The system will automatically map the columns to the appropriate chart properties
- Filter data by time ranges or other criteria to show relevant time-based charts
- Multiple rows create multi-point time series for hourly, weekly, or monthly visualization
Important Notes:
- Column names must match exactly as shown in the example (
value,name,title,chartColor,labelColor) - Column names are case-sensitive and must be spelled exactly as specified
- If data is not passed in the correct format or column names don’t match, the element will display as a plain
<rect>without any time-based visualization - The
namefield must contain valid timestamp or date strings for proper temporal ordering
Implementation Steps for Dataset Usage
To use dataset/CSV format with time-based charts, follow these steps:
Create Dataset: Import your data containing the required columns (value, name, title, chartColor, backgroundColor, labelColor)
Create Field: Create a field from your dataset that contains the time-based chart data
Set Value Formatting: In the field settings, set Value Formatting to “JSON” - this is crucial for proper data formatting
Override SVG Variables: In the SVG slide design tab, go to “Override SVG Variables”
Select Variable: Choose your time-based chart variable and use the format:
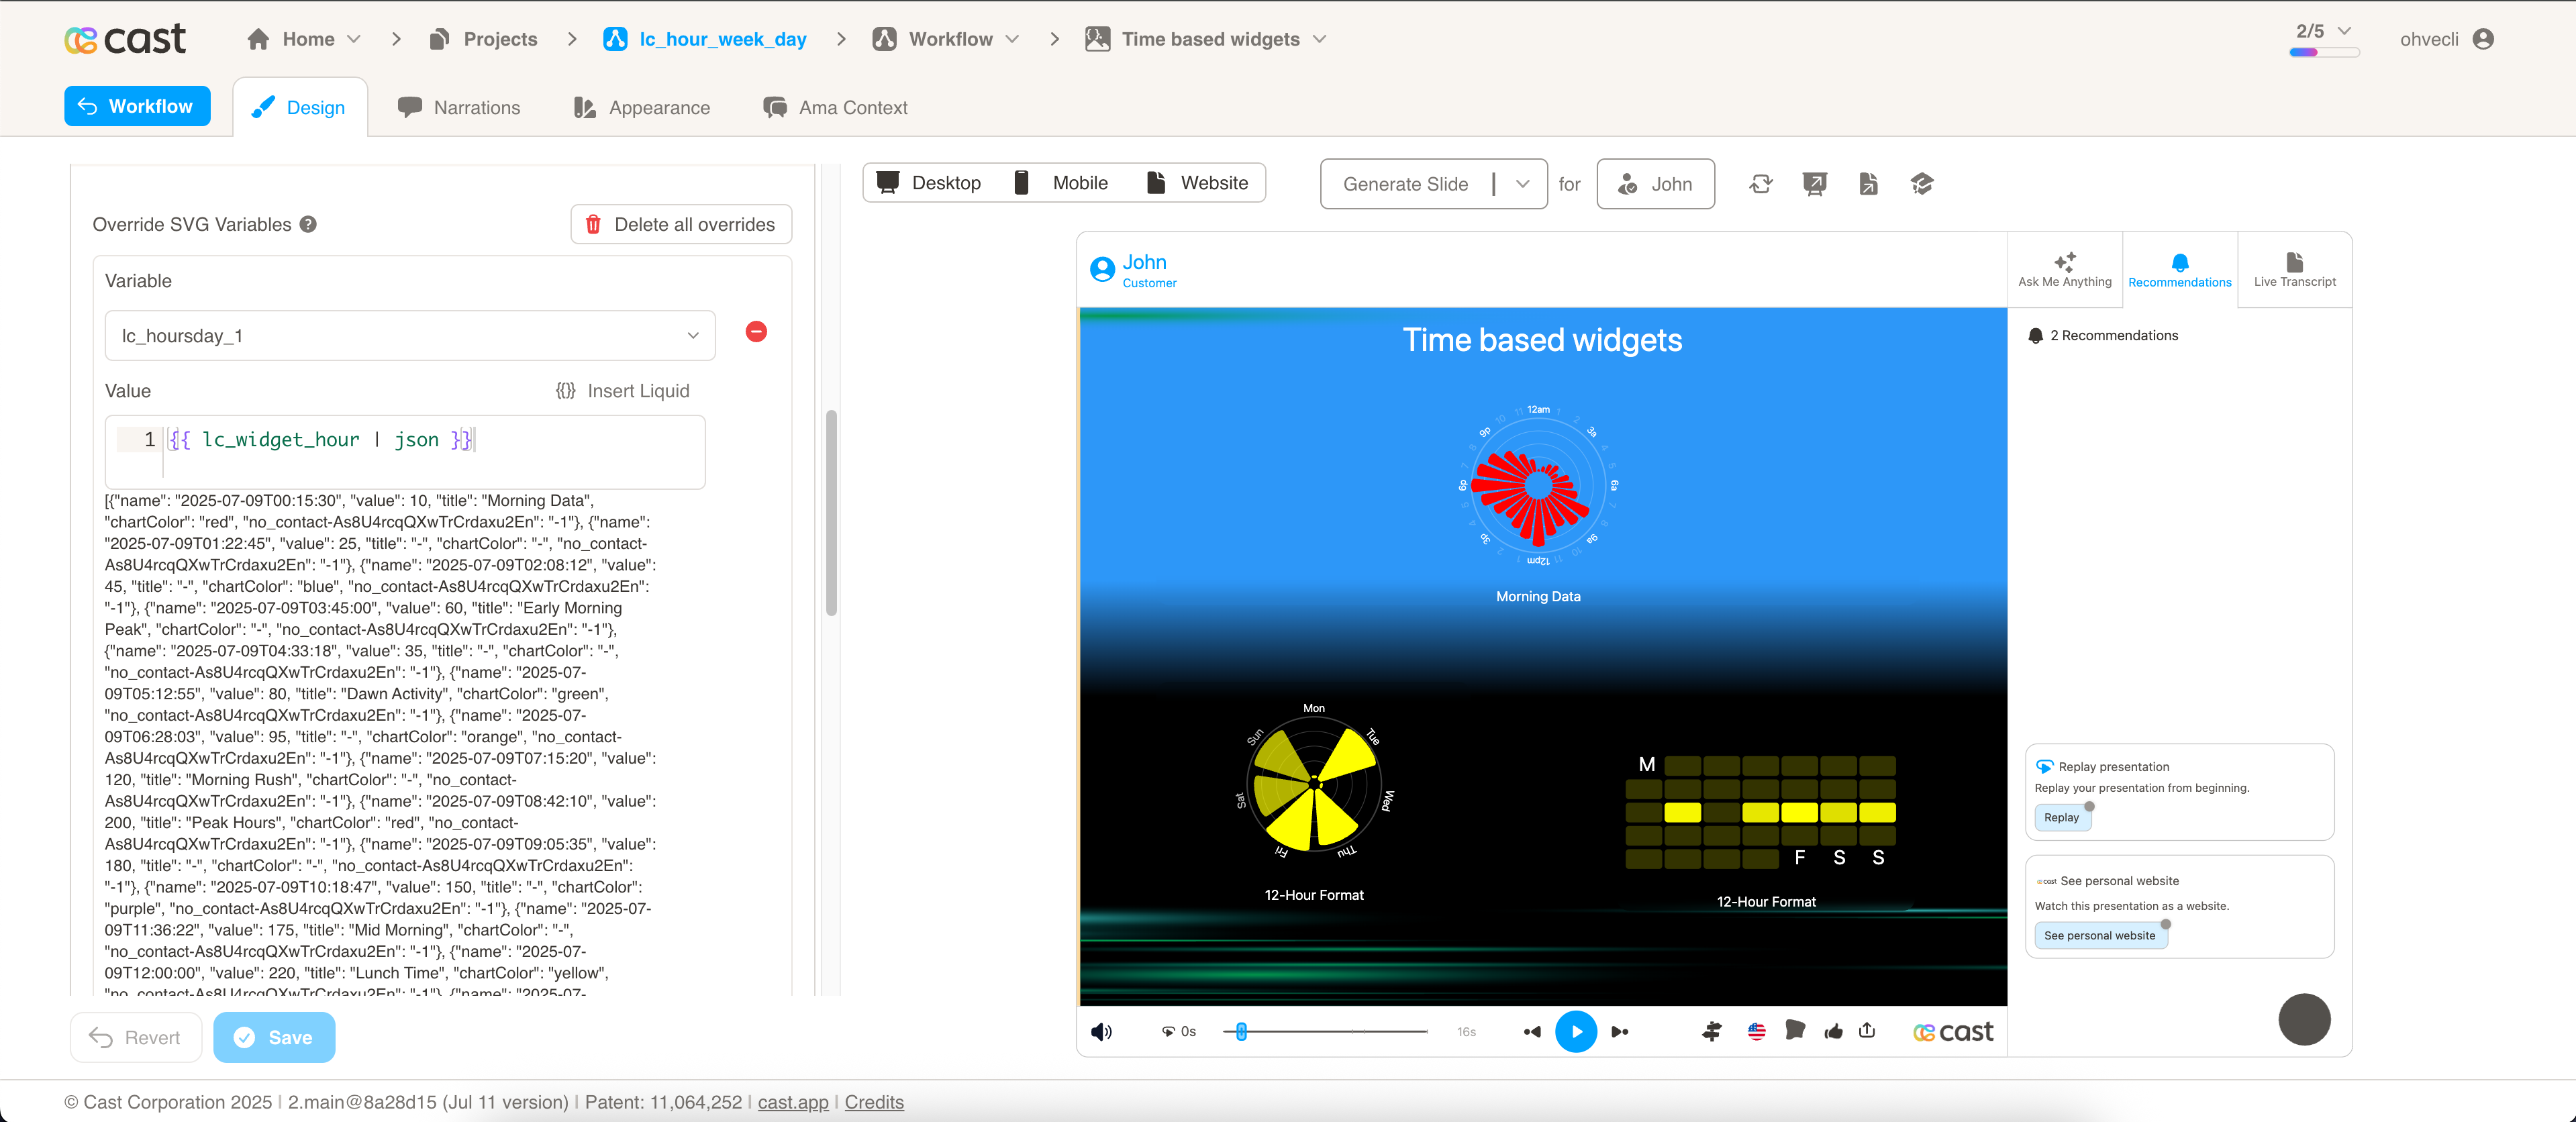
Include JSON Filter: Critical: Always include the | json filter with your field, otherwise the time-based chart will not work
Configuration Properties
Required Properties:
value: Numeric value for the data point (mandatory)name: Timestamp or date string for temporal positioning (mandatory)
Optional Properties:
title: Text title for the chart (optional)chartColor: Color specification for chart elements (optional)labelColor: Color for text labels (optional)color: Custom color for individual elements (lc_days_of_month only)
Additional Properties for lc_days_of_month:
When using lc_days_of_month_* in direct SVG slides (not widgets), additional properties are available:
color: Custom color for individual day cells (e.g.,"#FF5722","red")labelColor: Color for weekday headers, month caption, and day numbers
Color Specifications
Single Color:
- Provide a single color value:
"red","#FF0000" - Uses CSS color names or hex values
Color Priority and Behavior:
- First Object Rule: The system will only use the
chartColorfrom the first object in the JSON array - If the first object has a
chartColorspecified, that color will be used for the entire visualization - If the first object does not have a
chartColor(or it’s empty), the system will fall back to appearance settings and project color palette chartColorvalues in subsequent objects (second, third, etc.) are ignored
Default Behavior:
- If no color is provided in the first object, colors will be taken from the appearance settings and Color Palette
- This ensures consistency with your overall design palette
Time-Based Chart Types
Weekly Hour Visualization with lc_days_of_week_*
lc_hoursweek creates hour-by-hour visualizations across a week in a circular segment format, ideal for showing weekly activity patterns, recurring trends, and hourly performance across multiple days.
Best for:
- Weekly activity patterns and recurring trends
- Cross-day performance comparison
- Weekly operational analytics
- User behavior patterns across the week
- Business cycle analysis and planning
Implementation:
- Each data point represents different days within the week
- Displays data as colored segments in circular pie-chart format
- Different dates across the week with various time stamps
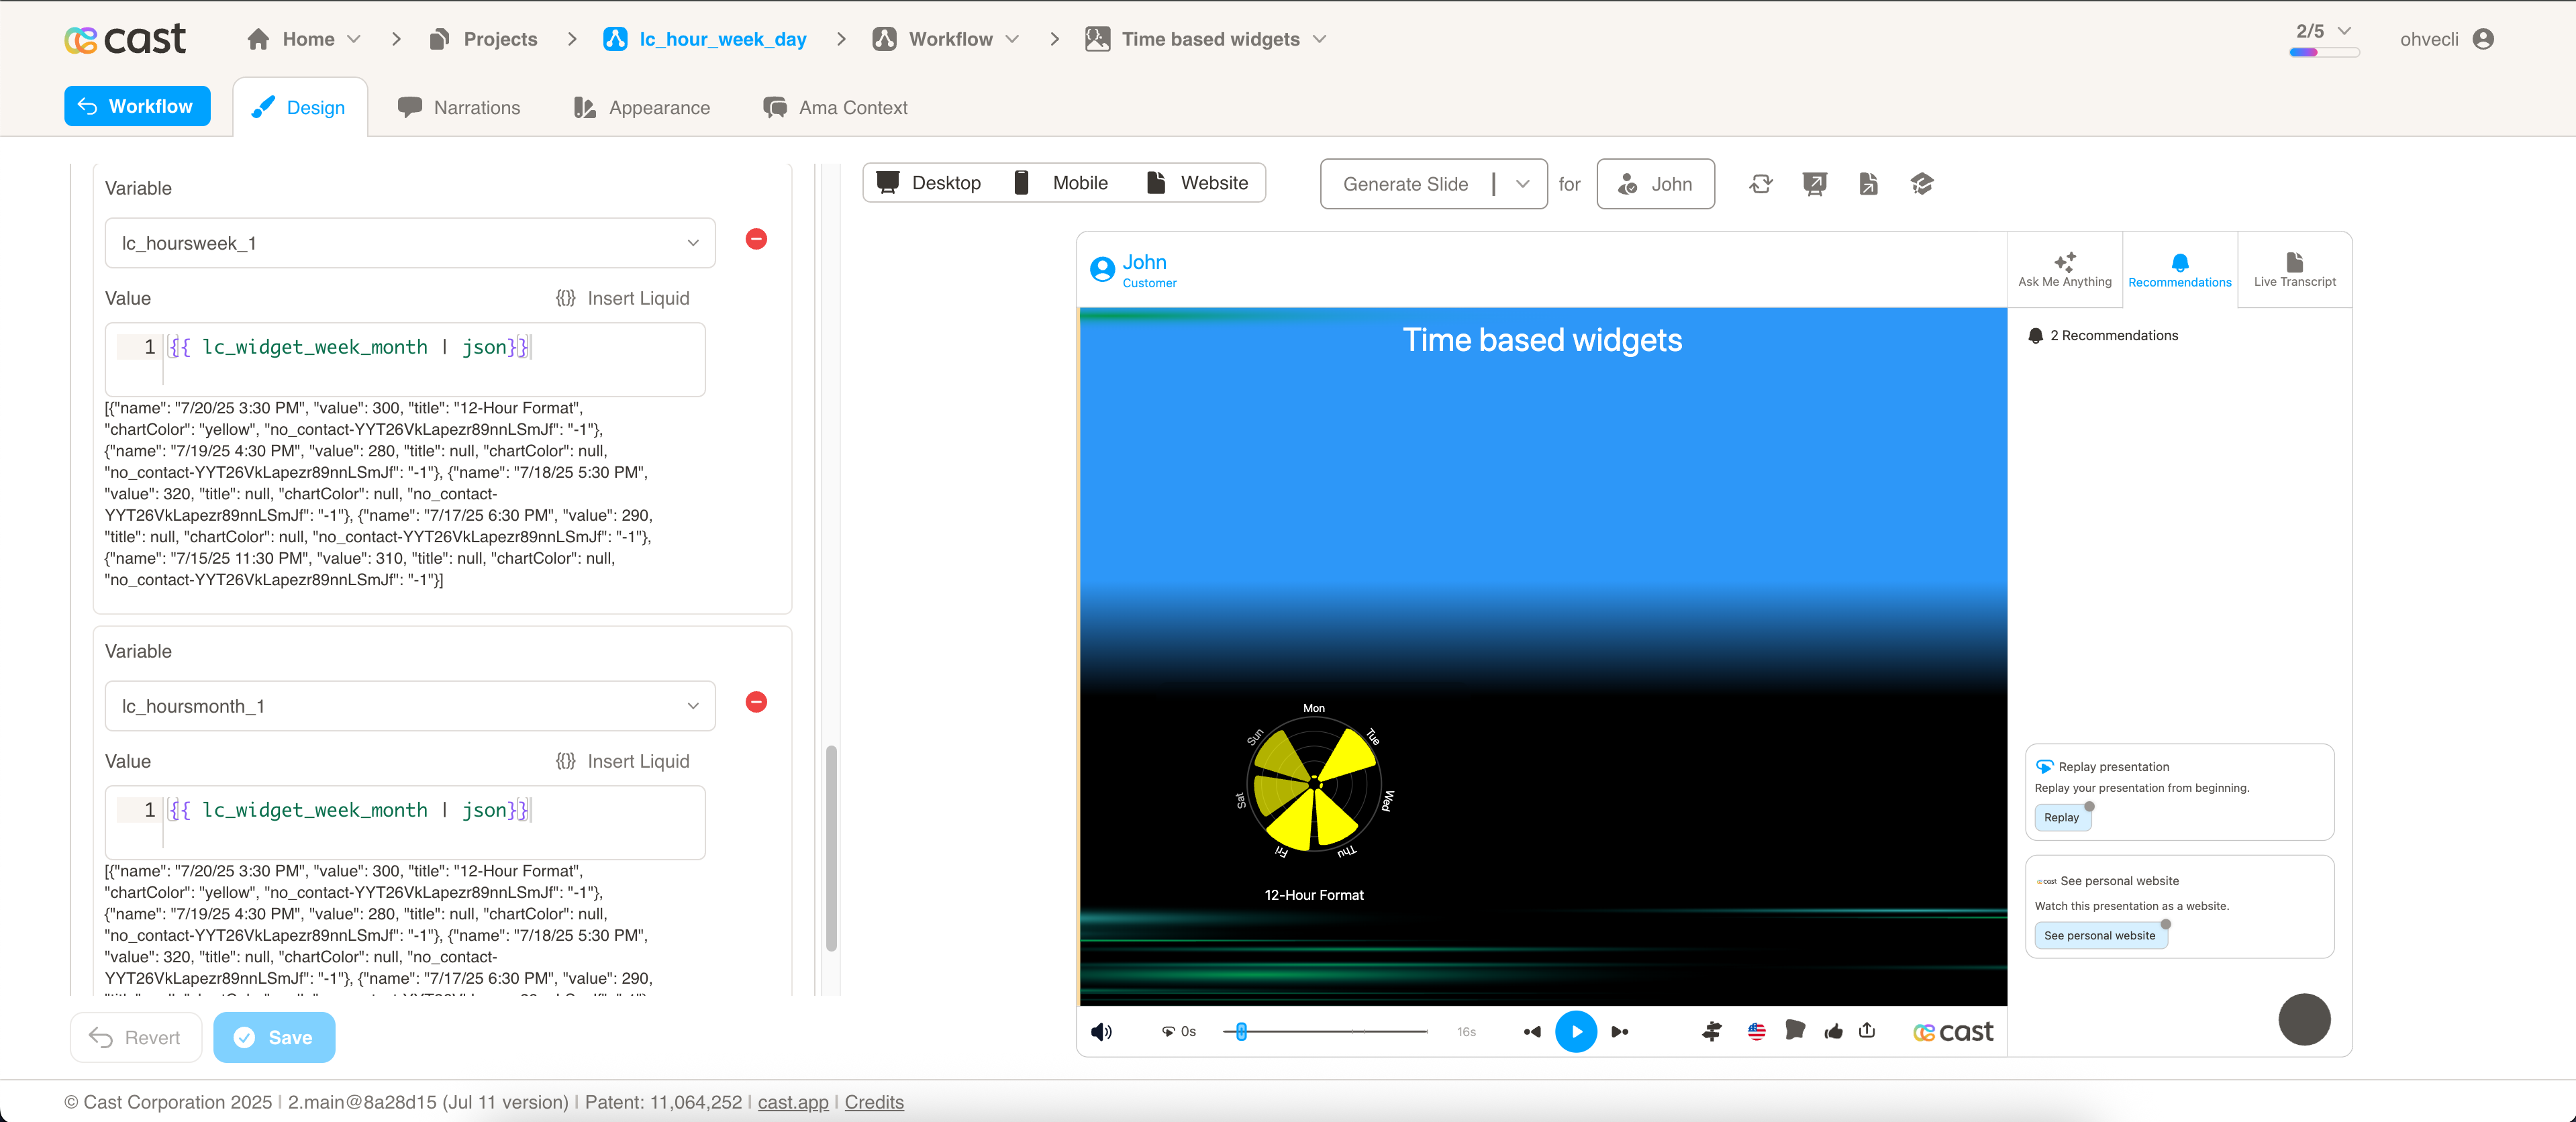
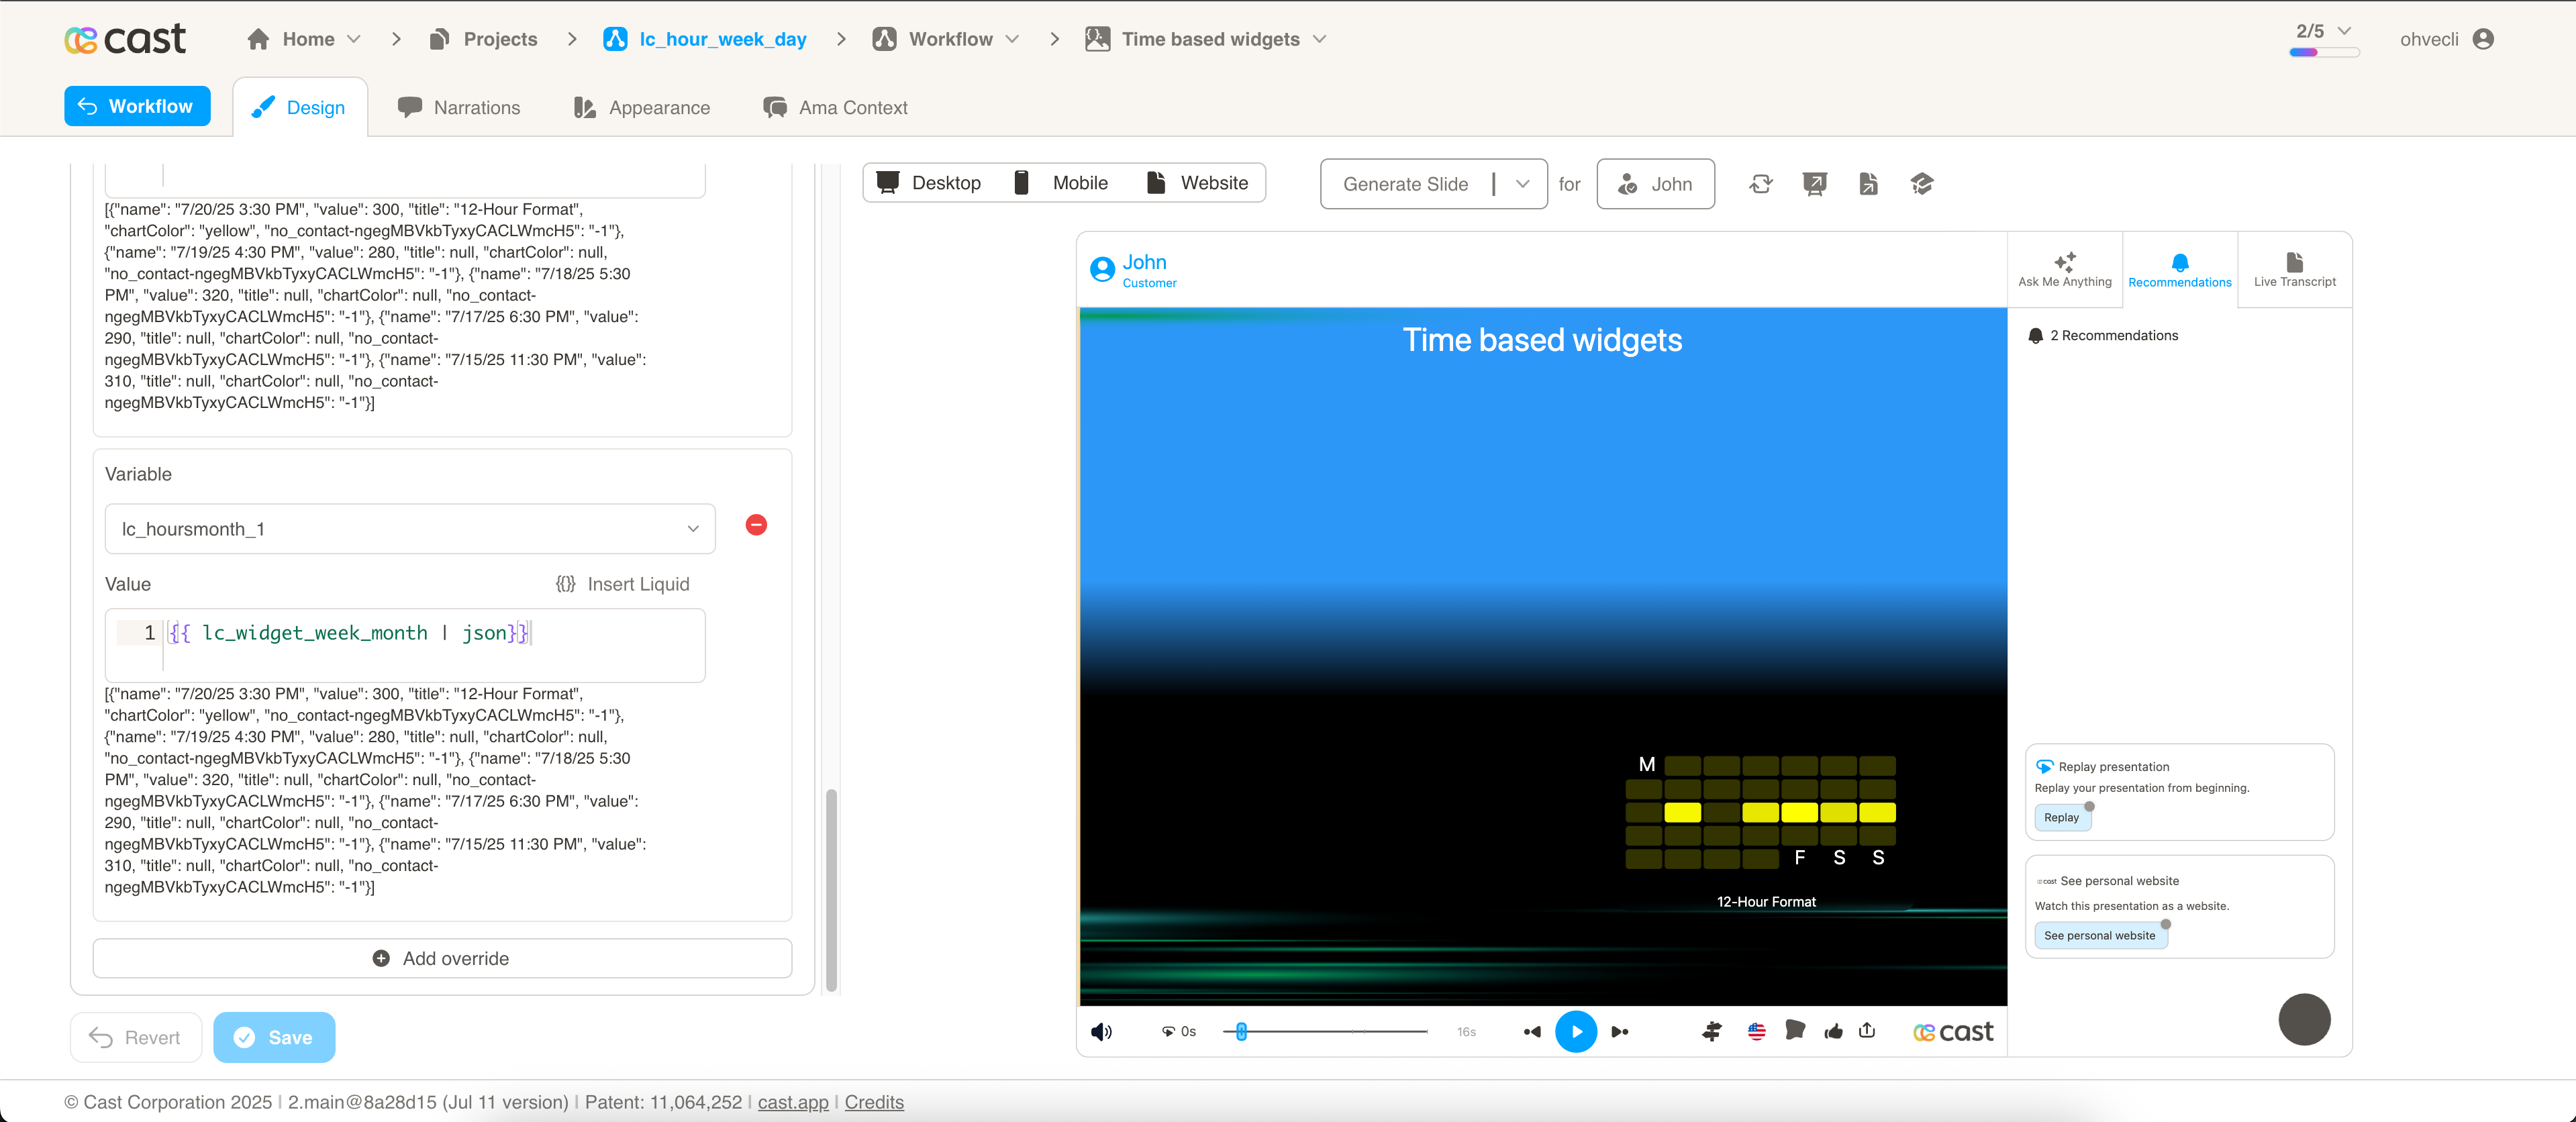
Monthly Day Visualization with lc_days_of_month_*
lc_hoursmonth creates day-by-day visualizations across a month in a grid/heatmap format, ideal for showing monthly trends, daily performance patterns, and month-long activity analysis.
Best for:
- Monthly trends and performance tracking
- Daily activity patterns across the month
- Monthly business intelligence and reporting
- Long-term trend analysis and forecasting
- Monthly operational metrics and KPIs
Implementation:
- Each data point represents a day within the month
- Displays data as colored squares in calendar-like grid layout
- Different dates across the month for comprehensive monthly view
Implementation Notes
- Time-based charts automatically scale to fit the container dimensions
- Data points are ordered chronologically based on the
namefield timestamps
Compatibility: Works with <rect> elements only
Example Usage
Styled Weekly Chart:
[
  {
    "value": "250",
    "name": "2025-07-20T03:00:00",
    "title": "Weekly Performance",
    "chartColor": "yellow",
    "labelColor": "red"
  },
  {
    "value": "280",
    "name": "2025-07-19T04:00:00",
    "title": "Weekly Performance"
  },
  {
    "value": "320",
    "name": "2025-07-26T05:00:00",
    "title": "Weekly Performance"
  }
]
Monthly Calendar with Custom Colors (lc_days_of_month only):
[
  {
    "value": "250",
    "name": "2023-01-01",
    "color": "#4CAF50",
    "labelColor": "#333333"
  },
  {
    "value": "280",
    "name": "2023-01-02",
    "color": "#FF9800"
  },
  {
    "value": "320",
    "name": "2023-01-03",
    "color": "#F44336"
  }
]