Funnel and Hannoi Visualization with lc_funnel_or_hannoi_*
The lc_funnel_or_hannoi_* prefix is used for SVG element IDs that need to display funnel or hannoi chart visualizations. The handler automatically detects whether to render as a funnel or hannoi chart based on your data patterns, making it perfect for conversion funnels, sales processes, department comparisons, and categorical data analysis.
Automatic Chart Type Detection
- Funnel Chart: Values in descending order → Trapezoid shapes that narrow from top to bottom
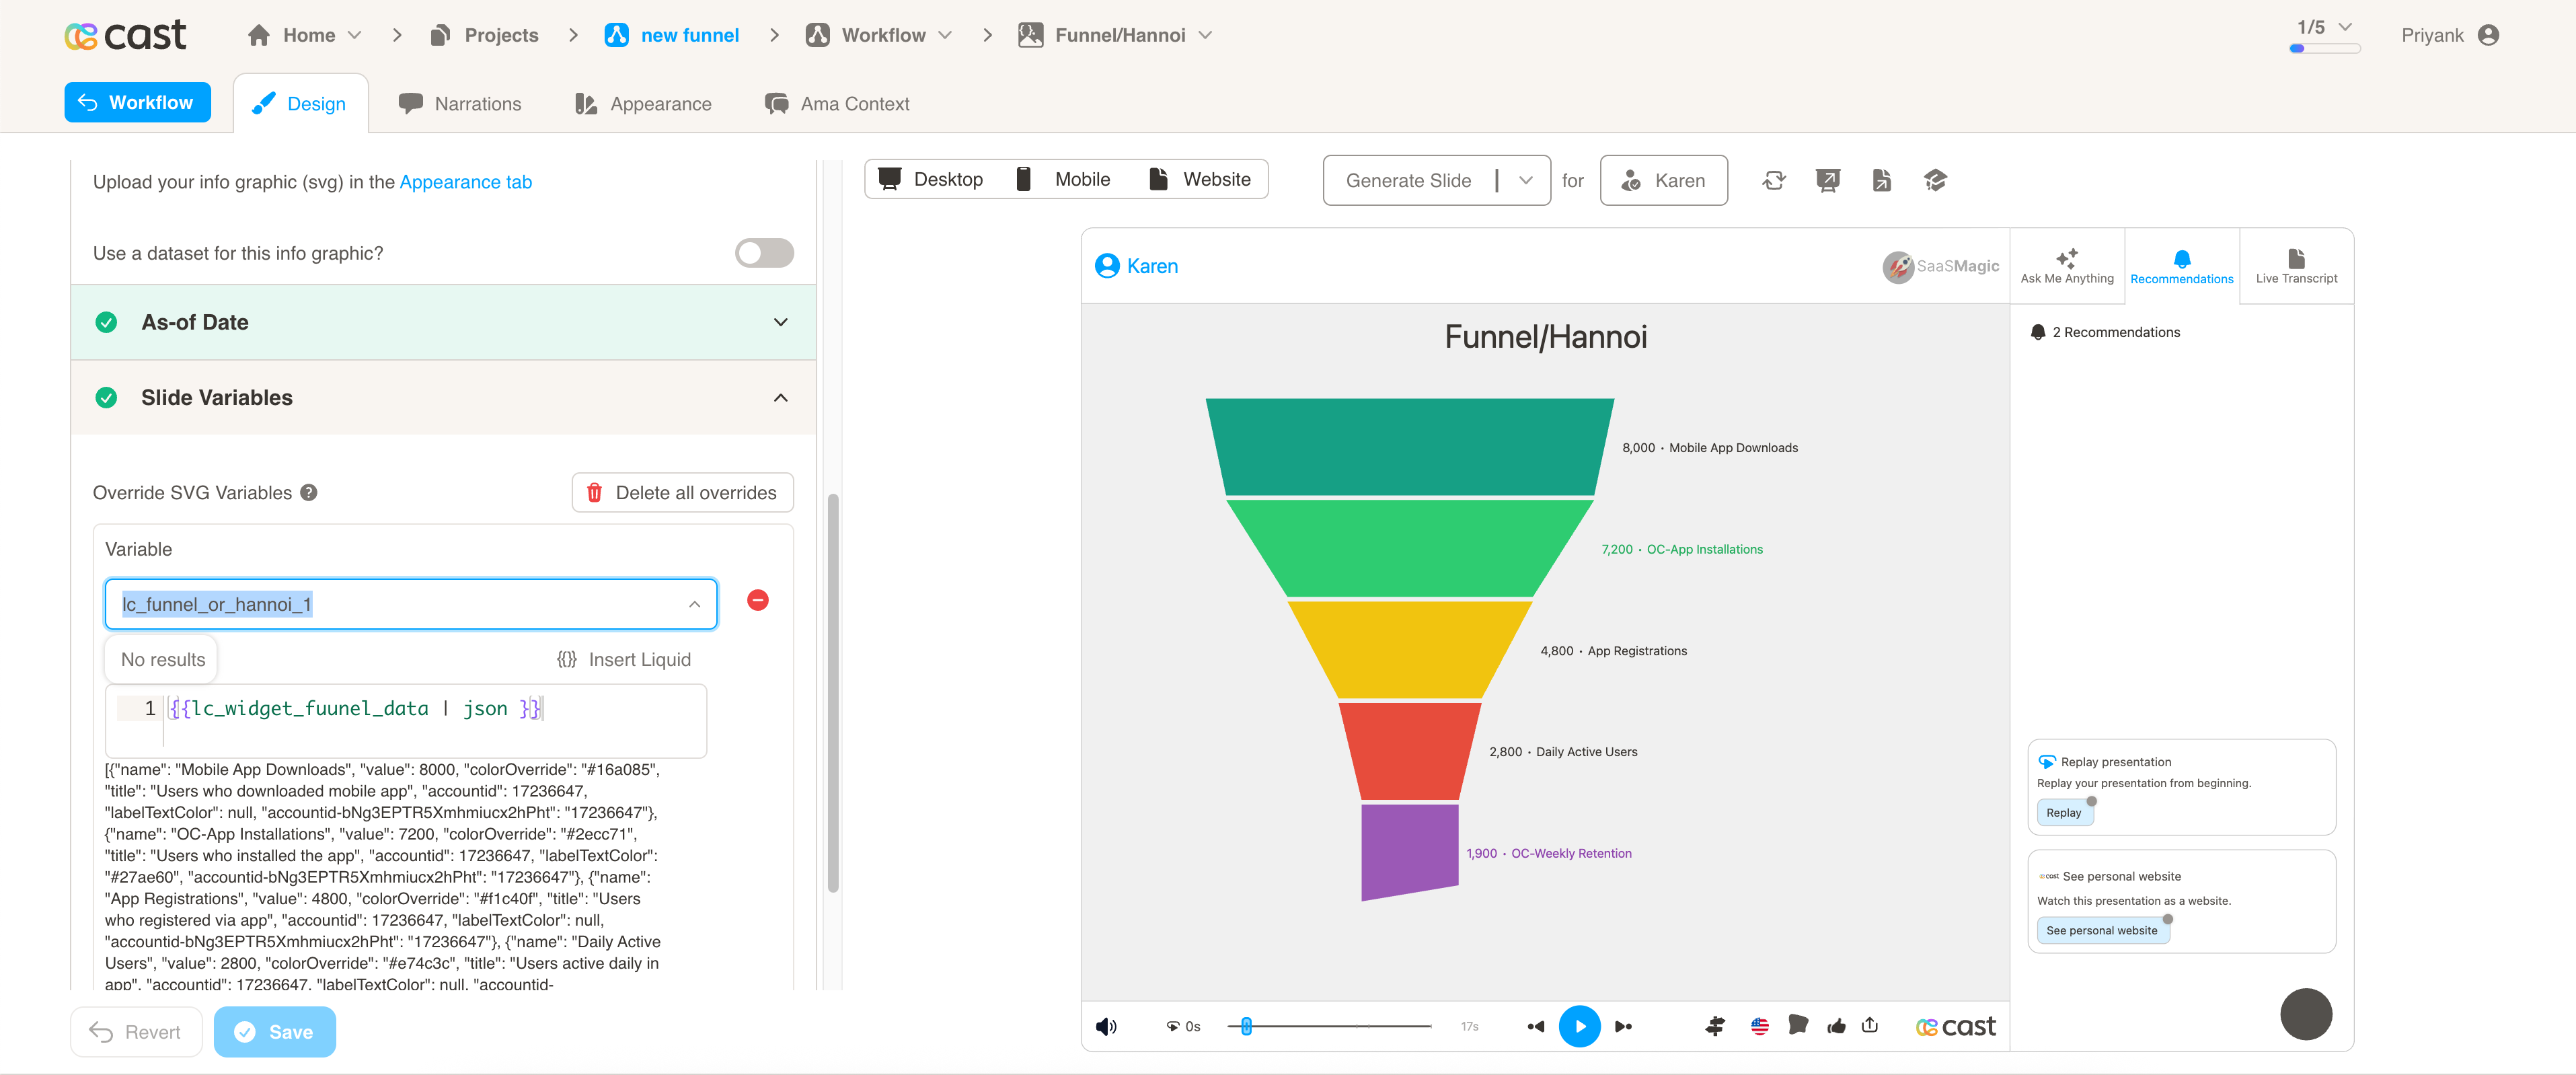
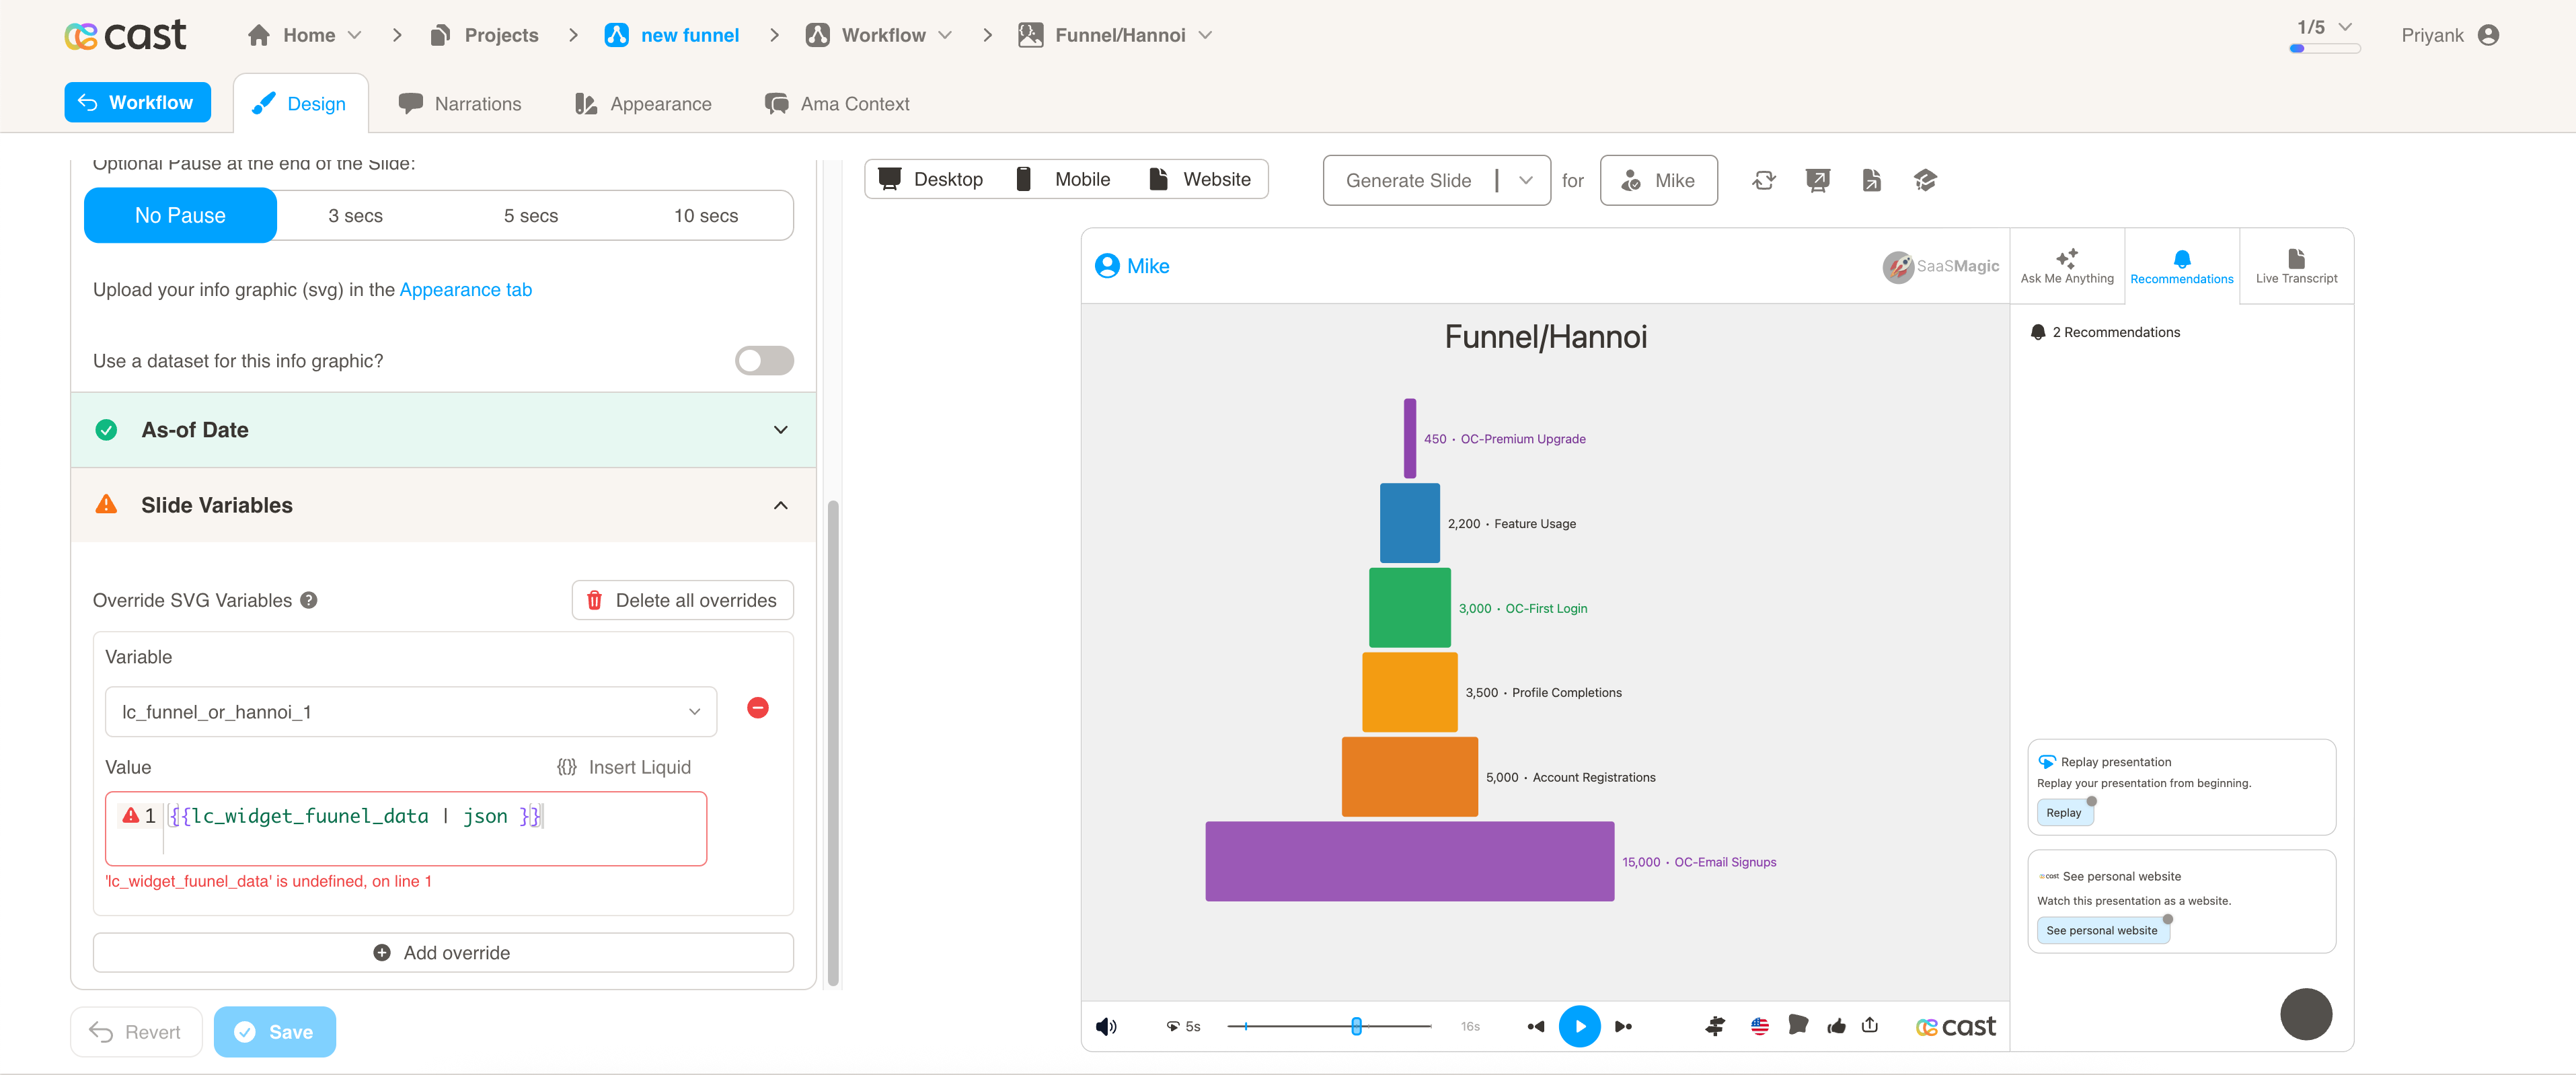
- Hannoi Chart: Values in mixed order → Uniform rounded rectangles with varying widths
Use Cases
Funnel Charts (Descending Values):
- Conversion funnels and sales processes
- User journey analysis and drop-off tracking
- Marketing campaign effectiveness
- Lead qualification and pipeline analysis
- Customer acquisition funnels
- Website conversion optimization
Hannoi Charts (Mixed Values):
- Department performance comparisons
- Category analysis and benchmarking
- Product or service comparisons
- Regional performance analysis
- Resource allocation visualization
- Non-sequential data comparison
Element Identification
The target element must be a <rect> with an ID that starts with lc_funnel_or_hannoi_* for automatic funnel or hannoi chart visualization.
Input Format
The input value must be provided as a JSON array of objects with the following structure:
JSON Format
A JSON string containing an array of objects with the following structure:
[
  {
    "name": "Website Visitors",
    "value": 125000,
    "colorOverride": "#3498db",
    "labelTextColor": "#2c3e50"
  },
  {
    "name": "Product Demo Requests",
    "value": 45000,
    "colorOverride": "#2ecc71",
    "labelTextColor": "#2c3e50"
  },
  {
    "name": "Trial Signups",
    "value": 18500,
    "colorOverride": "#f39c12"
  },
  {
    "name": "Paid Customers",
    "value": 5200,
    "colorOverride": "#9b59b6"
  }
]
Dataset/CSV Format
Alternatively, you can use tabular data from your datasets with the following columns:
| name | value | colorOverride | labelTextColor |
|---|---|---|---|
| Website Visitors | 125000 | #3498db | #2c3e50 |
| Product Demo Requests | 45000 | #2ecc71 | #2c3e50 |
| Trial Signups | 18500 | #f39c12 | #2c3e50 |
| Paid Customers | 5200 | #9b59b6 | #2c3e50 |
| Enterprise Customers | 850 | #e74c3c | #ffffff |
Download Sample Data - Funnel or Hannoi
Dataset Usage:
- Connect your funnel/hannoi chart to a dataset containing the required columns
- The system will automatically map the columns to the appropriate chart properties
- Filter data by categories or time ranges to show relevant comparisons
- Multiple rows create comprehensive funnel or hannoi visualizations
Important Notes:
- Column names must match exactly as shown in the example (
name,value,colorOverride,labelTextColor) - Column names are case-sensitive and must be spelled exactly as specified
- If data is not passed in the correct format or column names don’t match, the element will display as a plain
<rect>without any chart visualization - The
namefield supports auto-truncation at 22 characters for long names
Implementation Steps for Dataset Usage
To use dataset/CSV format with funnel/hannoi charts, follow these steps:
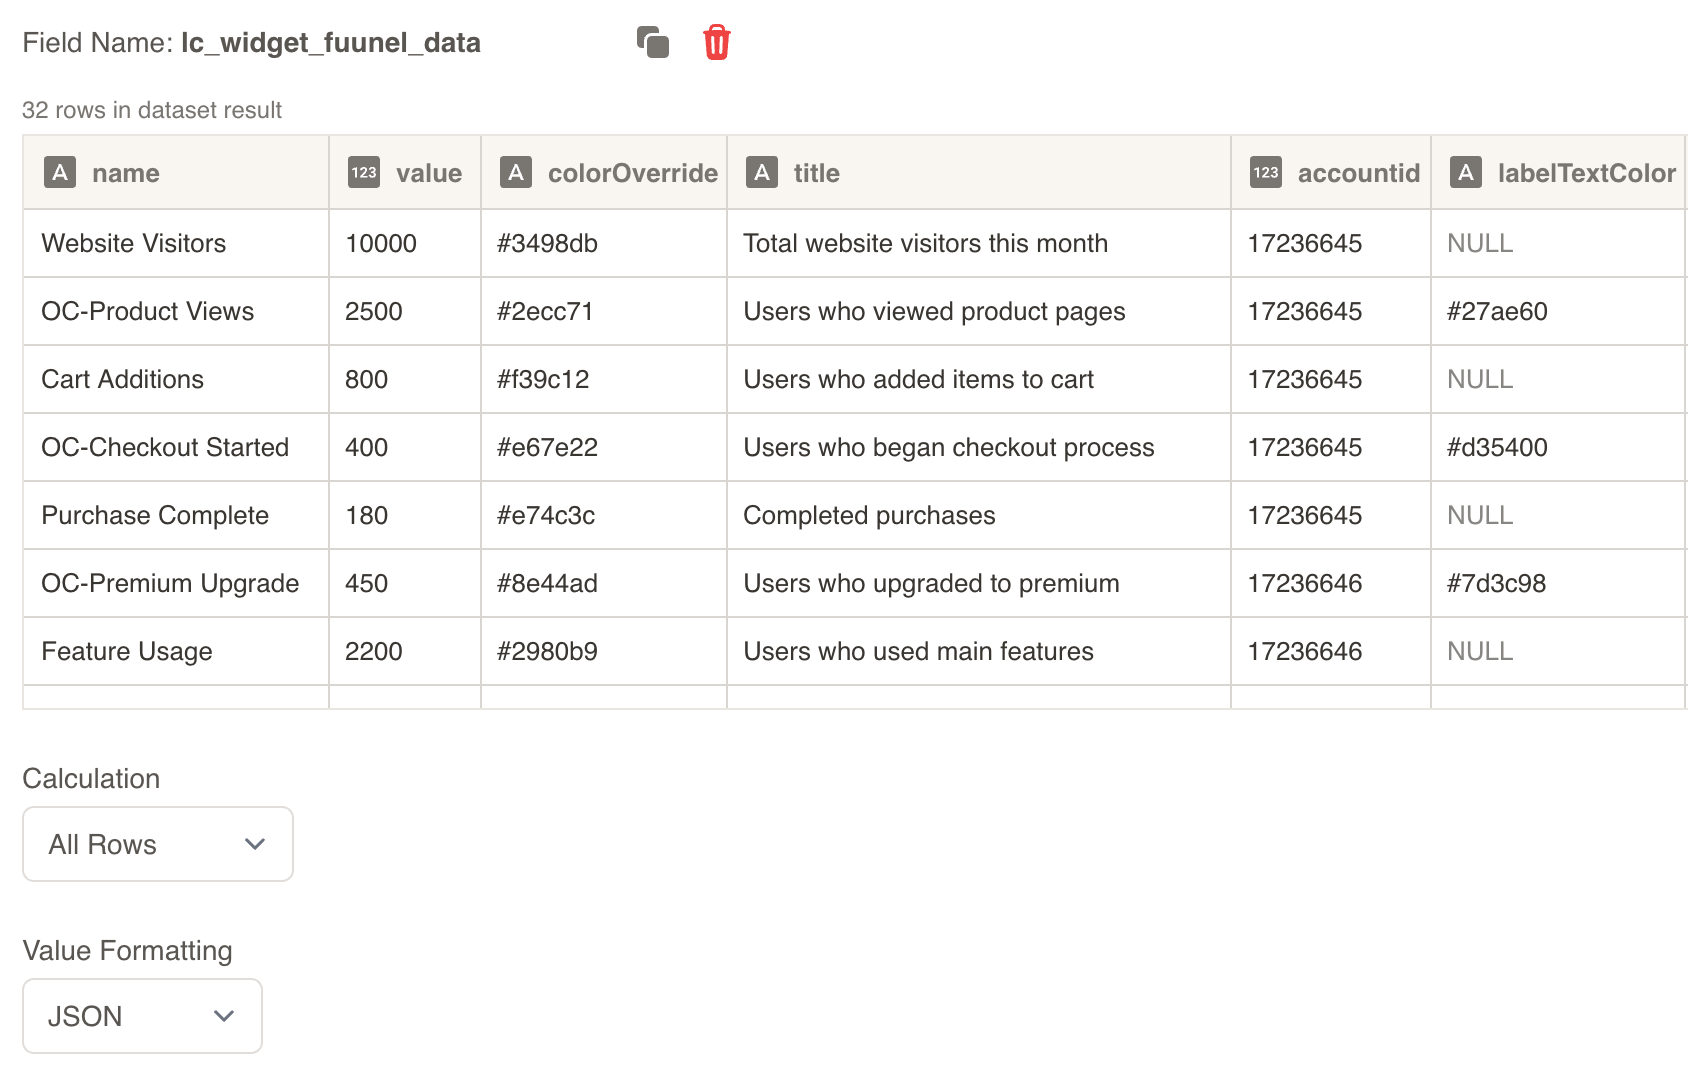
Create Dataset: Import your data containing the required columns (name, value, colorOverride, labelTextColor)
Create Field: Create a field from your dataset that contains the funnel/hannoi chart data
Set Value Formatting: In the field settings, set Value Formatting to “JSON” - this is crucial for proper data formatting
Override SVG Variables: In the SVG slide design tab, go to “Override SVG Variables”
Select Variable: Choose your funnel/hannoi chart variable and use the format with your field
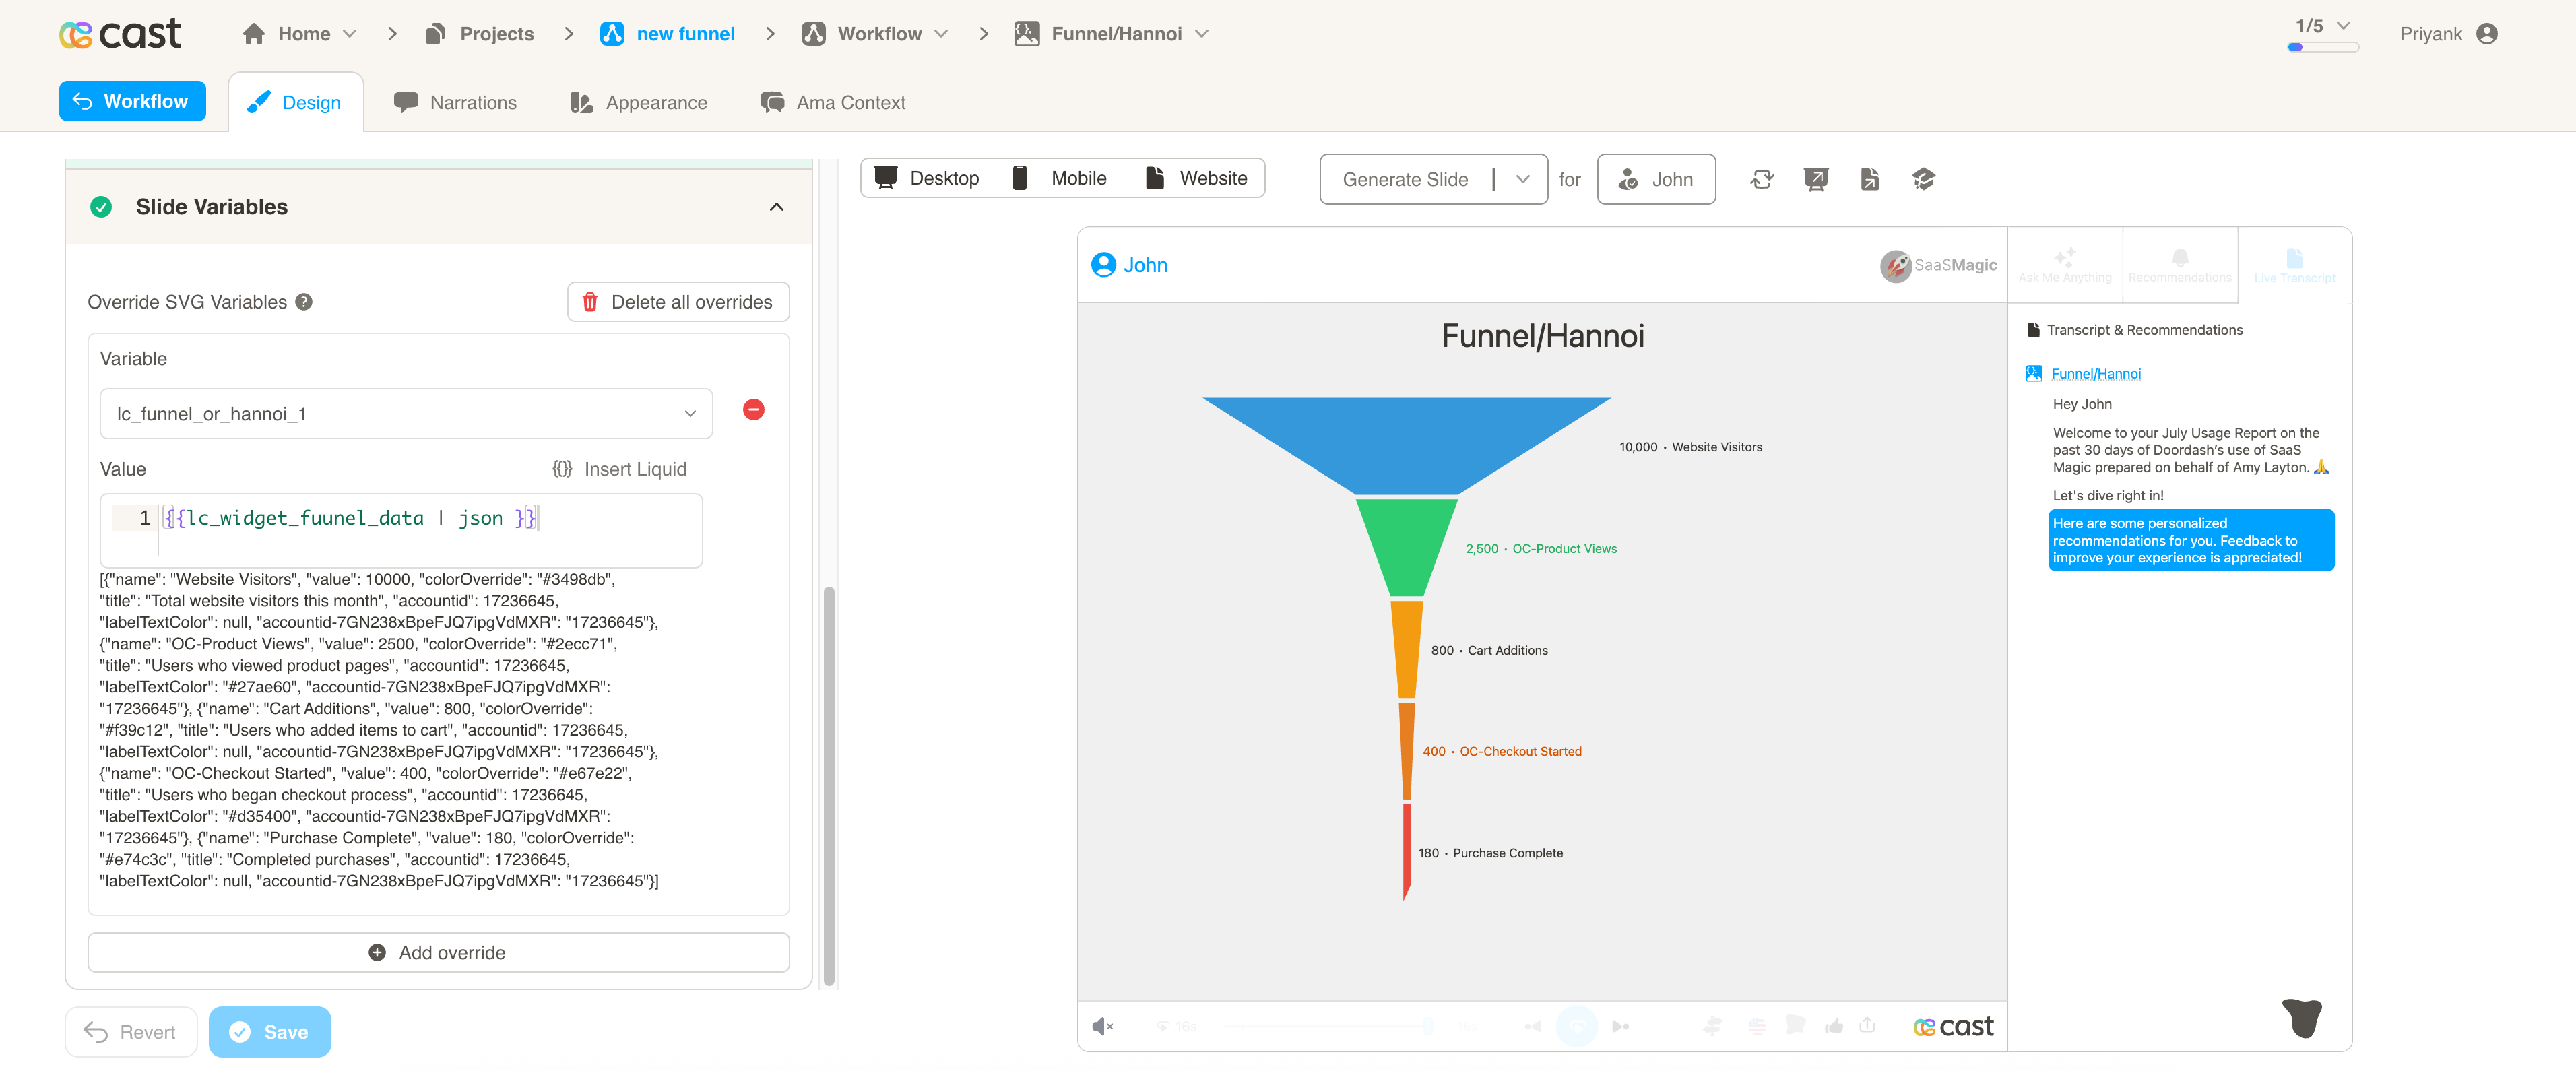
Include JSON Filter: Critical: Always include the | json filter with your field, otherwise the funnel/hannoi chart will not work
Configuration Properties
Required Properties:
name: Display name for the segment (mandatory, auto-truncated at 22 characters)value: Numeric value for the segment (mandatory, negative values converted to 0)
Optional Properties:
colorOverride: Custom hex color code or color name for segment fill (optional)labelTextColor: Custom hex color code or color name for label text (optional)
Color Specifications
Color Override:
- Provide hex color codes:
"#D32F2F","#F57C00" - Use CSS color names:
"red","blue","green" - Each segment can have its own individual color specification
Label Text Color:
- Provide hex color codes:
"#595551","#333333" - Use CSS color names for consistent text styling
- Controls the color of value labels and segment names
Color Behavior:
- If no colors are provided, colors will be auto-assigned from the appearance settings and project color palette
- Individual segments can override default colors for visual emphasis
- Colors ensure visual distinction between different segments
Compatibility: Works with <rect> elements only
Example Usage
Example 1: Sales Funnel (Descending Values → Funnel Chart)
JSON Data:
[
  { "name": "Leads Generated", "value": 10000, "colorOverride": "#3498db" },
  { "name": "Qualified Leads", "value": 7500, "colorOverride": "#2ecc71" },
  { "name": "Proposals Sent", "value": 5000, "colorOverride": "#f39c12" },
  { "name": "Negotiations", "value": 3000, "colorOverride": "#e74c3c" },
  { "name": "Closed Deals", "value": 1500, "colorOverride": "#9b59b6" }
]
Example 2: Quarterly Budget by Department (Mixed Values → Hannoi Chart)
JSON Data:
[
  {
    "name": "Engineering",
    "value": 2850000,
    "colorOverride": "#3498db",
    "labelTextColor": "#ffffff"
  },
  {
    "name": "Sales & Marketing",
    "value": 1950000,
    "colorOverride": "#2ecc71",
    "labelTextColor": "#ffffff"
  },
  {
    "name": "Customer Success",
    "value": 875000,
    "colorOverride": "#f39c12",
    "labelTextColor": "#2c3e50"
  },
  {
    "name": "Operations",
    "value": 1450000,
    "colorOverride": "#9b59b6",
    "labelTextColor": "#ffffff"
  },
  {
    "name": "Product Design",
    "value": 680000,
    "colorOverride": "#e74c3c",
    "labelTextColor": "#ffffff"
  }
]
Example 3: Customer Journey (Long Names with Truncation)
JSON Data:
[
  { "name": "Initial Brand Awareness and Discovery", "value": 50000 },
  { "name": "Active Research and Consideration", "value": 35000 },
  { "name": "Evaluation and Comparison Shopping", "value": 25000 },
  { "name": "Purchase Decision and Transaction", "value": 15000 },
  { "name": "Post-Purchase Experience and Support", "value": 12000 },
  { "name": "Loyalty and Repeat Purchase Behavior", "value": 8000 }
]
Example 4: Website Analytics (Custom Colors)
JSON Data:
[
  {
    "name": "Page Views",
    "value": 125000,
    "colorOverride": "#FF6B6B",
    "labelTextColor": "#2C3E50"
  },
  {
    "name": "Unique Visitors",
    "value": 95000,
    "colorOverride": "#4ECDC4",
    "labelTextColor": "#2C3E50"
  },
  {
    "name": "Engaged Sessions",
    "value": 67000,
    "colorOverride": "#45B7D1",
    "labelTextColor": "#2C3E50"
  },
  {
    "name": "Goal Completions",
    "value": 23000,
    "colorOverride": "#96CEB4",
    "labelTextColor": "#2C3E50"
  },
  {
    "name": "Conversions",
    "value": 8500,
    "colorOverride": "#FFEAA7",
    "labelTextColor": "#2C3E50"
  }
]
Highlighting Individual Segments
Funnel and Hannoi charts support selective highlighting during your presentation, allowing you to draw attention to specific segments while others fade into the background.
How It Works:
When you reference a segment’s name in your narration, that segment automatically highlights (full brightness) while other segments dim to about 12% brightness. Labels remain fully visible so your audience can always read them.
Setting Up Highlights:
To enable highlighting, your funnel/hannoi data must include the name property. The system matches these names with your highlight configuration to determine which segments to highlight.
Important Note: Your data uses the name field, but highlights use the label key to match. For example:
- Data:
{"name":"Qualified Leads","value":7500} - Highlight:
[{"label":"Qualified Leads"}]
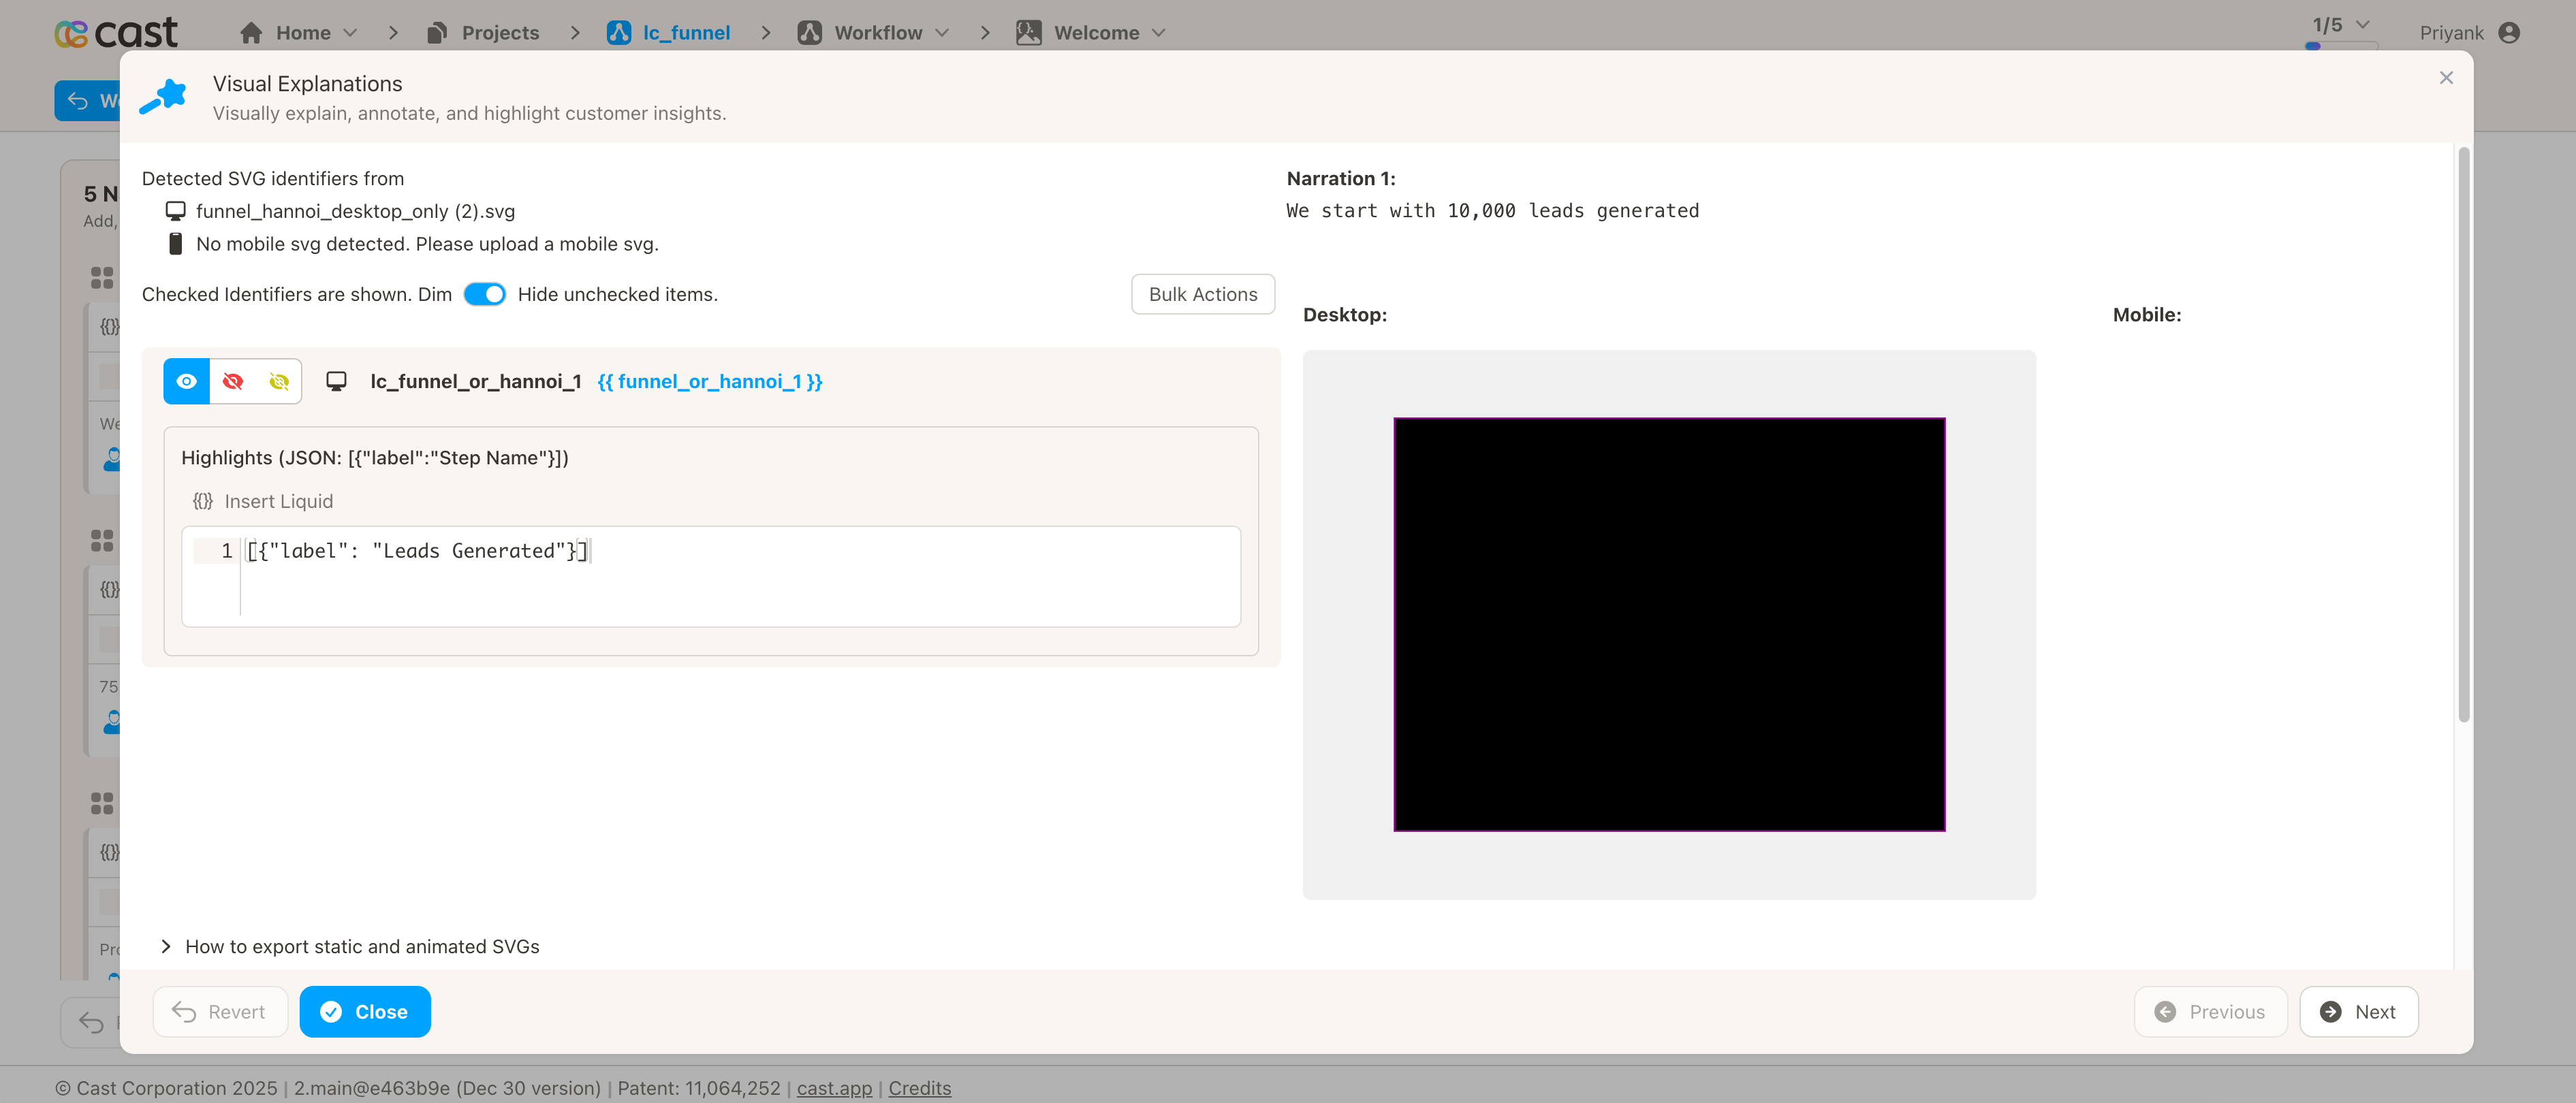
How to Add Highlights in Cast Designer:
- Open your project in Cast designer
- Navigate to Narration tab
- Click on Visual Explanations for the slide with your funnel/hannoi chart
- Find the liquid block for your
lc_funnel_or_hannoielement - Add the highlight format directly in the liquid block
Preview Result:
Highlight Format:
Single segment:
[{ "label": "Qualified Leads" }]
Multiple segments:
[{ "label": "Qualified Leads" }, { "label": "Closed Deals" }]
All segments visible (no dimming):
(Don't add any highlight to the liquid block)
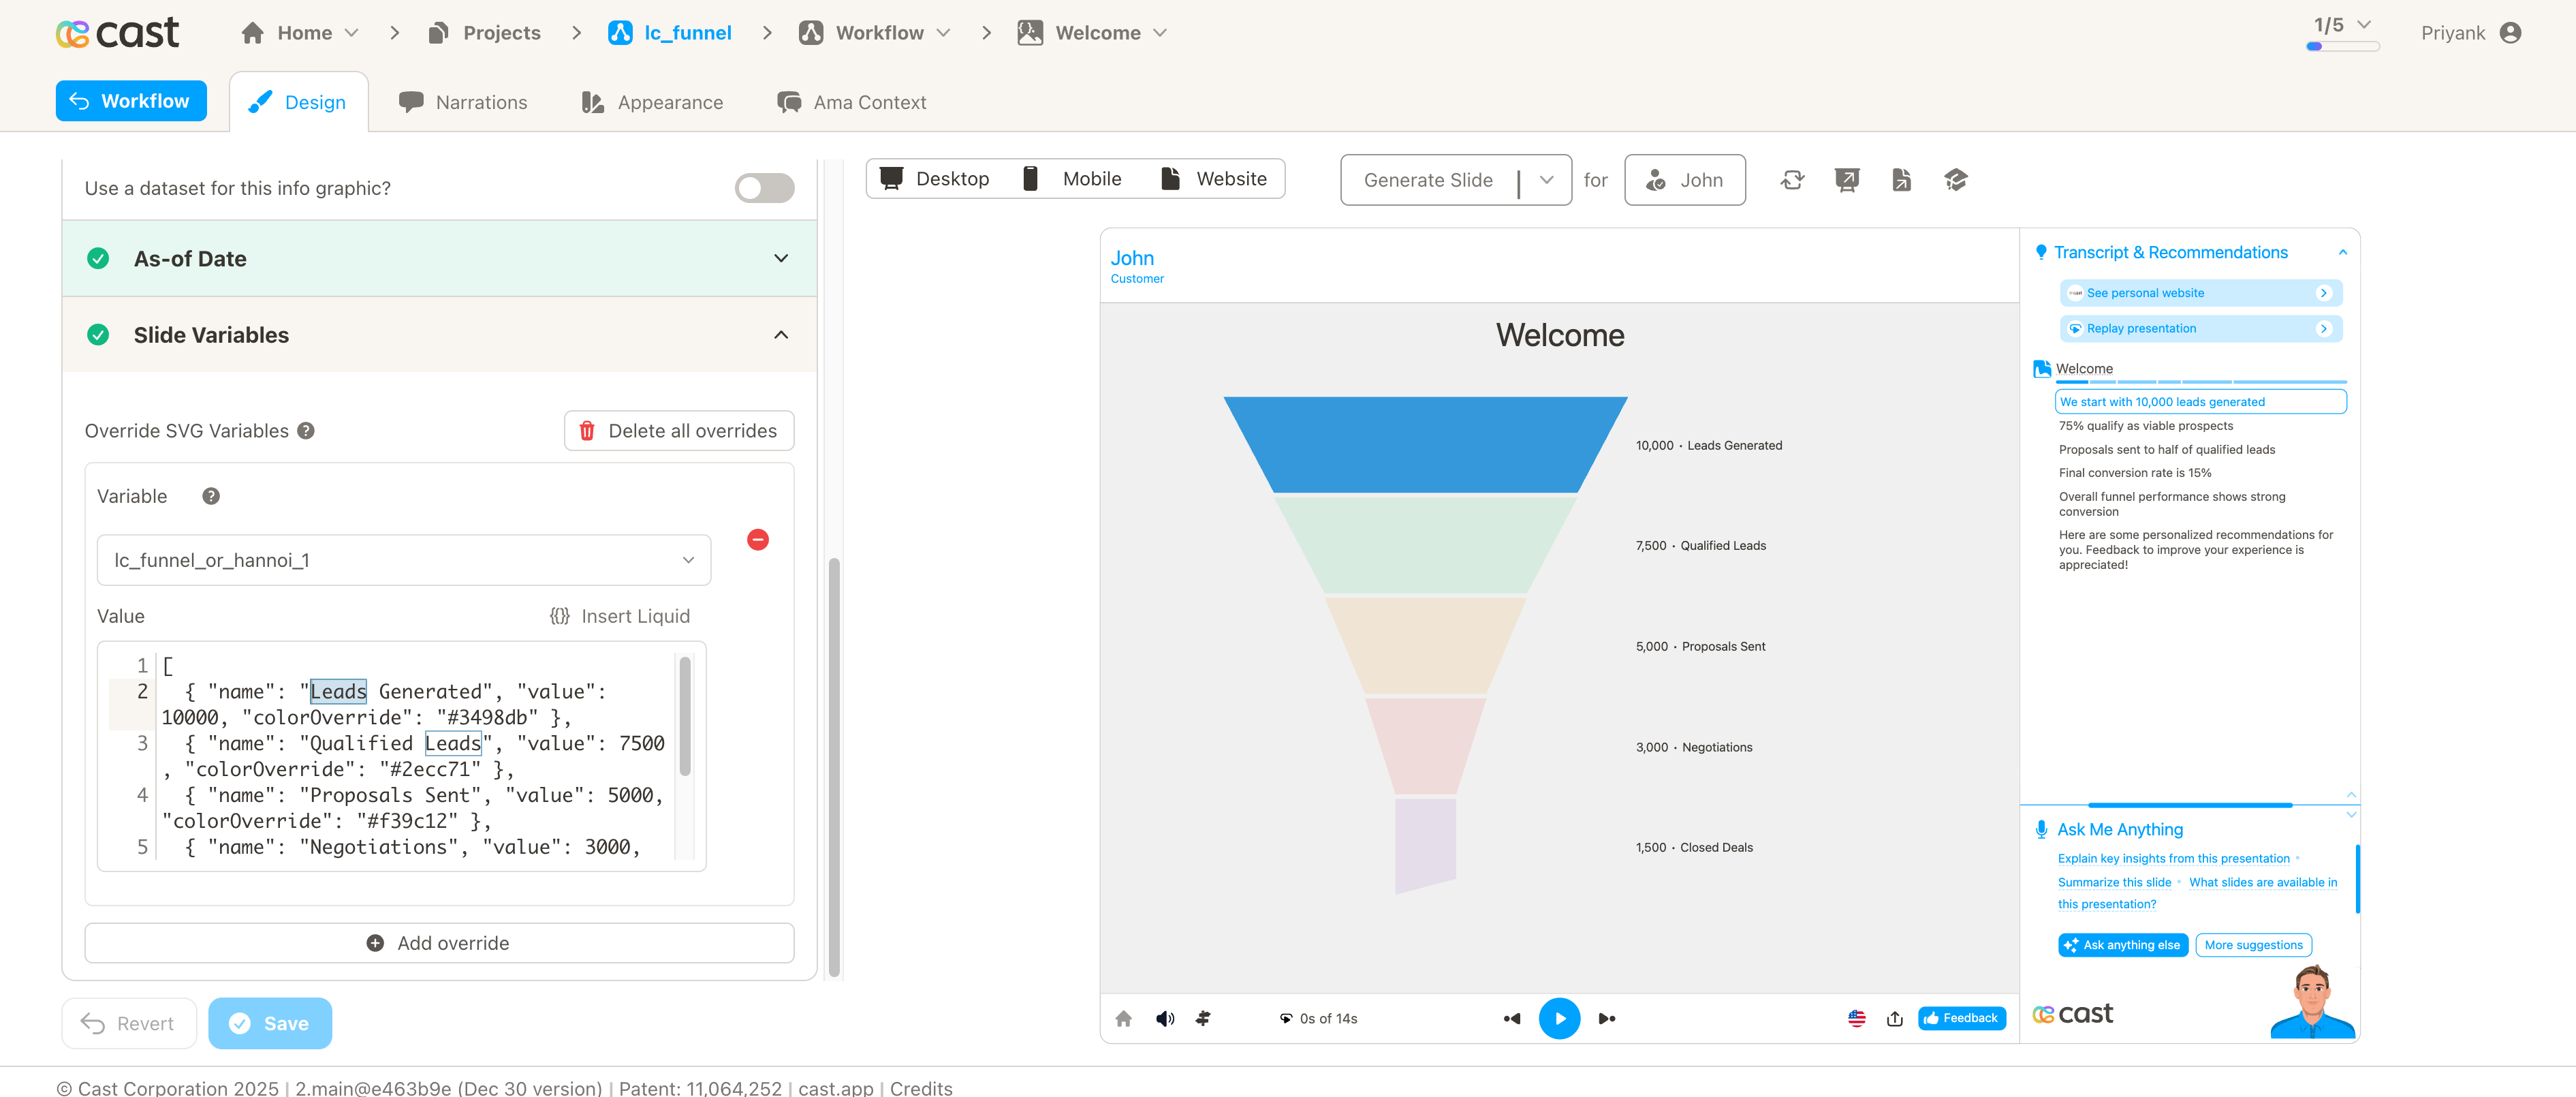
Example 1: Sales Funnel Analysis
Your Funnel Data:
[
  { "name": "Leads Generated", "value": 10000, "colorOverride": "#3498db" },
  { "name": "Qualified Leads", "value": 7500, "colorOverride": "#2ecc71" },
  { "name": "Proposals Sent", "value": 5000, "colorOverride": "#f39c12" },
  { "name": "Negotiations", "value": 3000, "colorOverride": "#e74c3c" },
  { "name": "Closed Deals", "value": 1500, "colorOverride": "#9b59b6" }
]
Narration Steps:
-
Narration Step 1: “We start with 10,000 leads generated…”
- Add to liquid block:
[{"label": "Leads Generated"}] - Result: Leads Generated segment stays bright, all others dim
- Add to liquid block:
-
Narration Step 2: “75% qualify as viable prospects…”
- Add to liquid block:
[{"label": "Qualified Leads"}] - Result: Qualified Leads segment brightens, others dim
- Add to liquid block:
-
Narration Step 3: “Proposals sent to half of qualified leads…”
- Add to liquid block:
[{"label": "Proposals Sent"}] - Result: Proposals Sent segment brightens, others dim
- Add to liquid block:
-
Narration Step 4: “Final conversion rate is 15%…”
- Add to liquid block:
[{"label": "Closed Deals"}] - Result: Closed Deals segment brightens, others dim
- Add to liquid block:
-
Narration Step 5: “Overall funnel performance shows strong conversion…”
- Add to liquid block: Don’t add any highlight
- Result: All segments appear at full brightness
Example 2: Department Budget Comparison (Hannoi Chart)
Your Hannoi Data:
[
  {
    "name": "Engineering",
    "value": 2850000,
    "colorOverride": "#3498db",
    "labelTextColor": "#ffffff"
  },
  {
    "name": "Sales & Marketing",
    "value": 1950000,
    "colorOverride": "#2ecc71",
    "labelTextColor": "#ffffff"
  },
  {
    "name": "Customer Success",
    "value": 875000,
    "colorOverride": "#f39c12",
    "labelTextColor": "#2c3e50"
  },
  {
    "name": "Operations",
    "value": 1450000,
    "colorOverride": "#9b59b6",
    "labelTextColor": "#ffffff"
  },
  {
    "name": "Product Design",
    "value": 680000,
    "colorOverride": "#e74c3c",
    "labelTextColor": "#ffffff"
  }
]
Liquid Block Highlights:
-
All Departments Overview: Show all segments together (no specific highlight)
- Liquid block: Don’t add any highlight
- Result: All segments appear at full brightness
-
Focus on Engineering: “Engineering receives the largest allocation…”
- Liquid block:
[{"label": "Engineering"}] - Result: Engineering segment brightens, others dim
- Liquid block:
-
Sales and Marketing Investment: “Sales & Marketing accounts for significant spending…”
- Liquid block:
[{"label": "Sales & Marketing"}] - Result: Sales & Marketing segment brightens, others dim
- Liquid block:
-
Compare Top Spenders: “Engineering and Sales & Marketing together…”
- Liquid block:
[{"label": "Engineering"}, {"label": "Sales & Marketing"}] - Result: Both Engineering and Sales & Marketing segments bright, others dim
- Liquid block:
Example 3: Customer Journey Funnel
Your Funnel Data:
[
  {
    "name": "Page Views",
    "value": 125000,
    "colorOverride": "#FF6B6B",
    "labelTextColor": "#2C3E50"
  },
  {
    "name": "Unique Visitors",
    "value": 95000,
    "colorOverride": "#4ECDC4",
    "labelTextColor": "#2C3E50"
  },
  {
    "name": "Engaged Sessions",
    "value": 67000,
    "colorOverride": "#45B7D1",
    "labelTextColor": "#2C3E50"
  },
  {
    "name": "Goal Completions",
    "value": 23000,
    "colorOverride": "#96CEB4",
    "labelTextColor": "#2C3E50"
  },
  {
    "name": "Conversions",
    "value": 8500,
    "colorOverride": "#FFEAA7",
    "labelTextColor": "#2C3E50"
  }
]
Liquid Block Highlights:
-
“We recorded 125,000 page views…“
- Liquid block:
[{"label": "Page Views"}] - Result: Page Views segment highlights
- Liquid block:
-
“Engagement rate is strong with 67,000 sessions…“
- Liquid block:
[{"label": "Engaged Sessions"}] - Result: Engaged Sessions segment highlights
- Liquid block:
-
“Final conversion rate stands at 6.8%…“
- Liquid block:
[{"label": "Conversions"}] - Result: Conversions segment highlights
- Liquid block:
-
“The complete journey from view to conversion…“
- Liquid block: Don’t add any highlight
- Result: All segments at full brightness