lc_column_* and lc_column_bg_*
Create vertical columns that automatically adjust height based on data values. Perfect for time series or rankings.
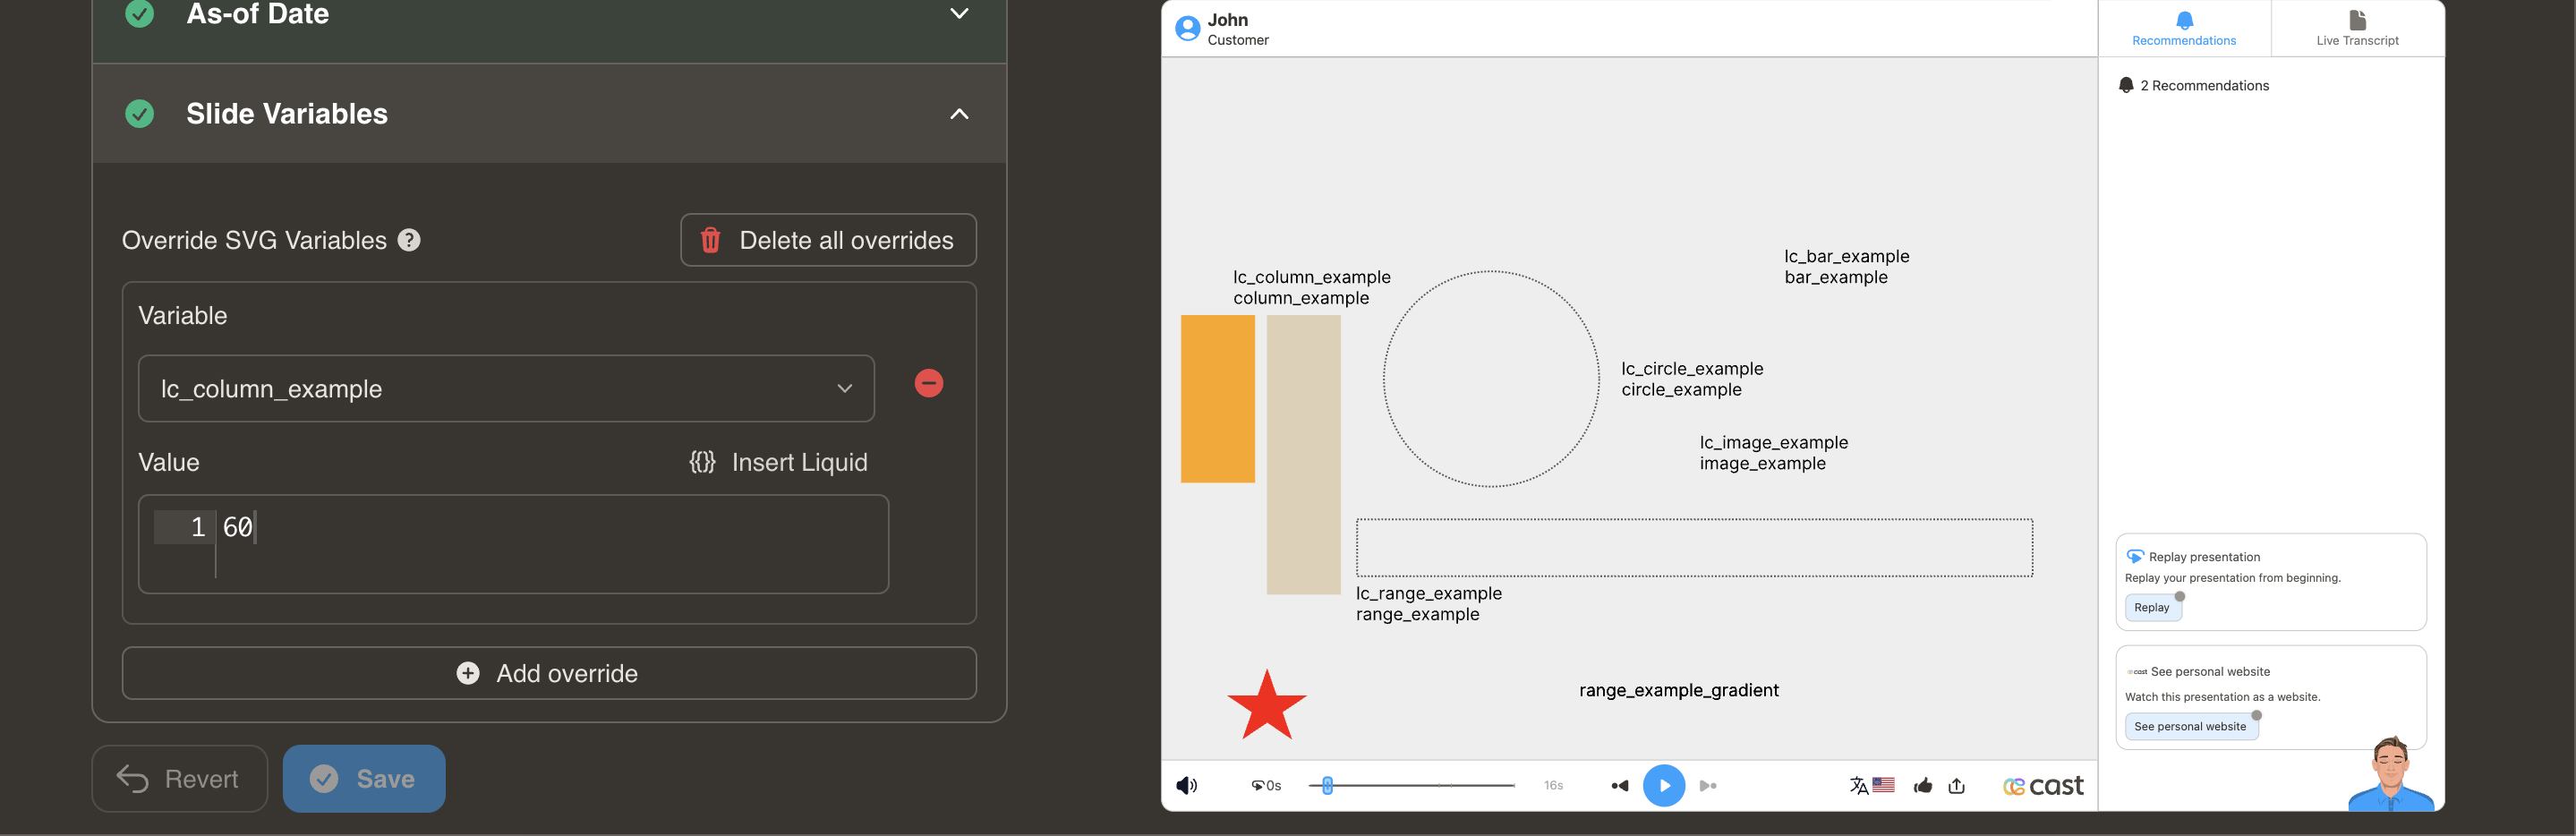
Element Setup
Main Column:
- Element type:
<rect> - ID format:
lc_column_*(e.g.,lc_column_jan,lc_column_q3)
Background Column (Optional):
- Element type:
<rect> - ID format:
lc_column_bg_* - Creates semi-transparent background at 30% opacity
Input Format
Simple Format - Value Only:
"60"
Sets column height to 60%
JSON Format - Value with Color:
{
  "value": 75,
  "color": "yellow"
}
Color Options: Same as bar charts (hex, CSS names, RGB)
Value Clamping
- Range: 0% to 100%
- Values above 100% → clamped to 100%
- Negative values → not processed
Usage Example
<!-- In your SVG -->
<rect id="lc_column_bg_q1" width="40" height="200" fill="#ccc" />
<rect id="lc_column_q1" width="40" height="200" fill="#FF5722" />

<!-- In your dataset -->
{{ q1 }} = "85"
<!-- OR with color -->
{{ q1 }} = '{"value": 85, "color": "green"}'
Result: Column displays at 85% height from bottom, growing upward