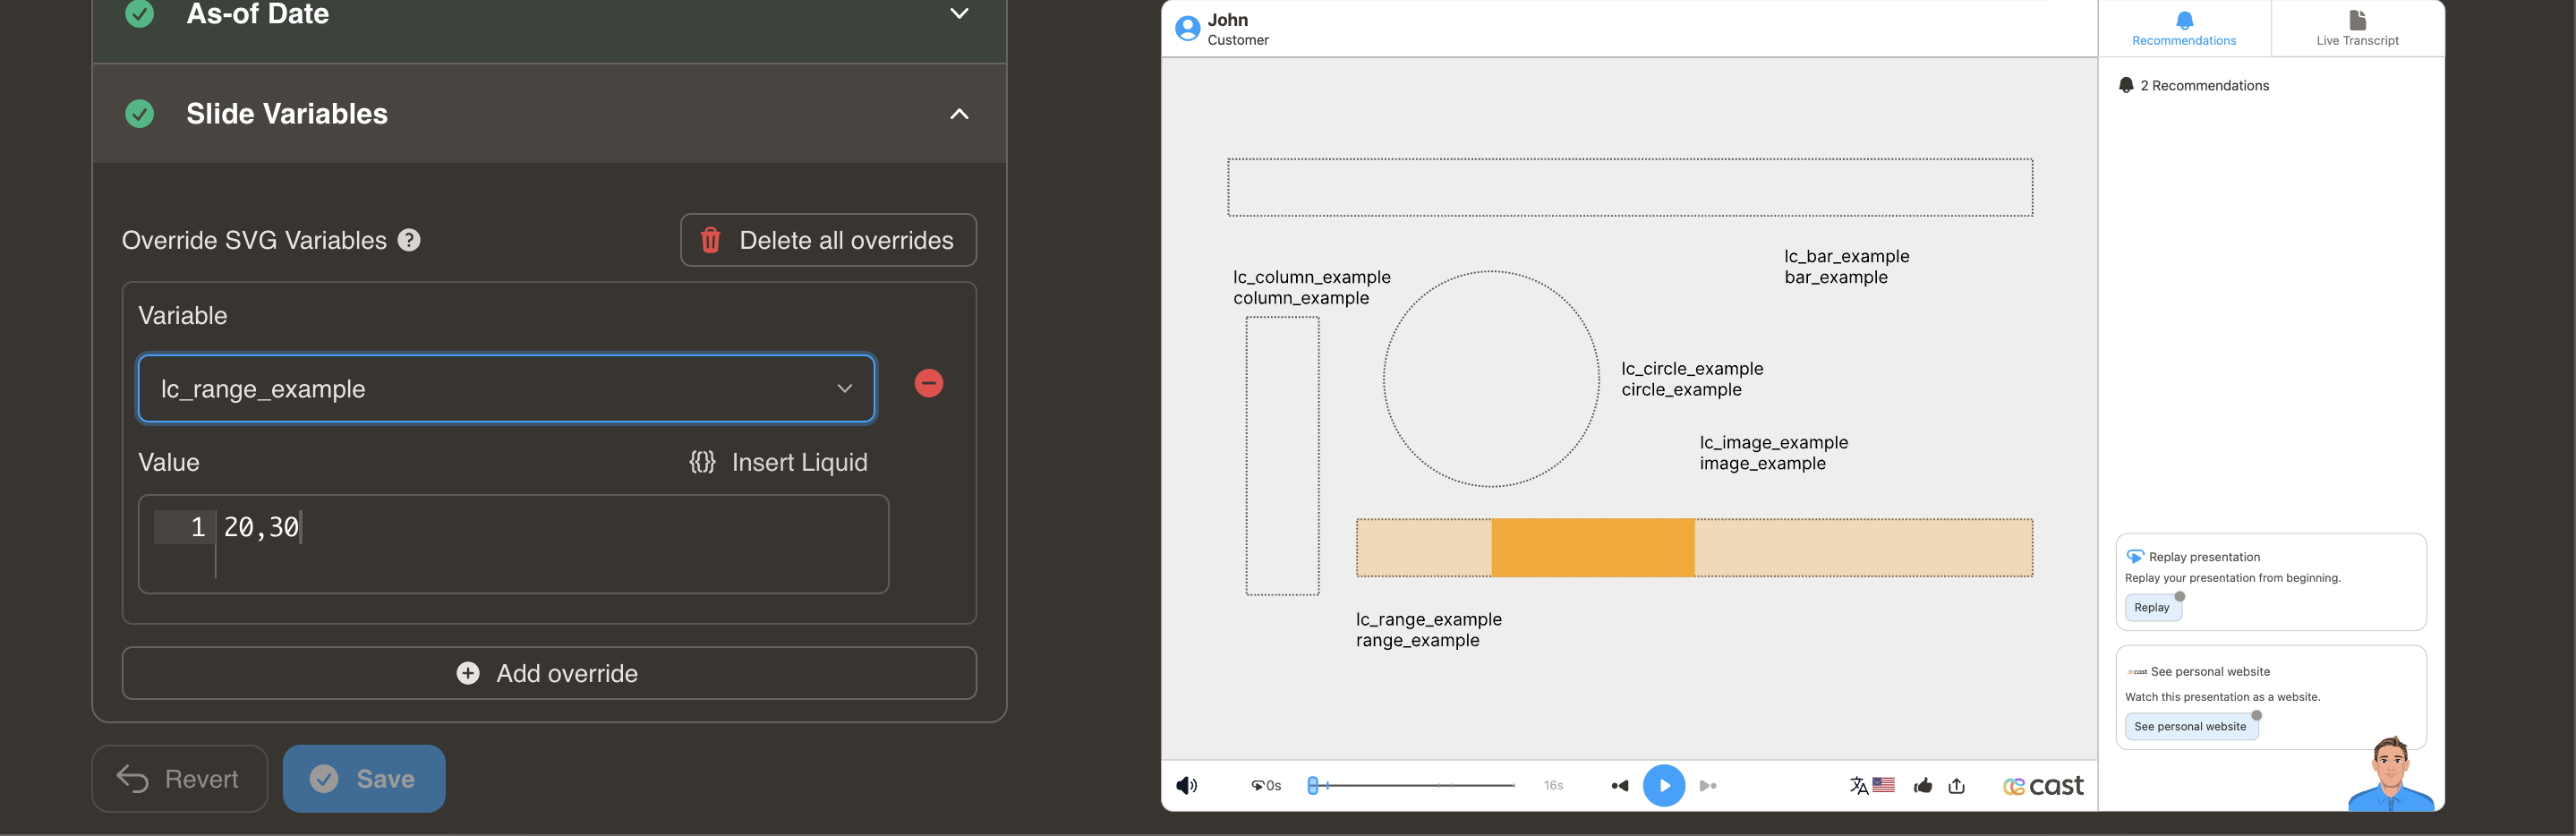
lc_range_* and lc_range_bg_*
Show min-max values or data ranges with adjustable position and width.
Element Setup
Main Range:
- Element type:
<rect> - ID format:
lc_range_*(e.g.,lc_range_temperature,lc_range_pricing)
Background Track (Optional):
- Element type:
<rect> - ID format:
lc_range_bg_* - Creates background track at 30% opacity
Input Format
Position and Width:
"10,40"
- First value (10): Starting position at 10%
- Second value (40): Width of 40%
Value Clamping
- Position (X): 1% to 100%
- Width: 0% to (100% - position)
- Combined values cannot exceed 100%
- Negative values → not processed
Usage Example
<!-- In your SVG -->
<rect id="lc_range_bg_price" width="200" height="10" fill="#ccc" />
<rect id="lc_range_price" width="200" height="10" fill="#FF9800" />

<!-- In your dataset -->
{{ price }} = "20,50"
Result: Range indicator starts at 20% and spans 50% of total width
Common Use Cases:
- Price ranges ($20K - $70K)
- Temperature ranges (20°C - 35°C)
- Time windows (9am - 5pm)
- Age demographics (25-65 years)