lc_doughnut_*
Display segmented data in a circular doughnut chart format. The chart always displays as a complete circle with values proportionally adjusted to fill the entire circumference.
Element Setup
Main Element:
- Element type:
<circle>— lc_doughnut requires a “circle” svg element with a stroke for border. Border is used to determine the thickness. - ID format:
lc_doughnut_*(e.g.,lc_doughnut_nps,lc_doughnut_market-share)
Companion Element:
- Use lc_label_* for legends and segment labels
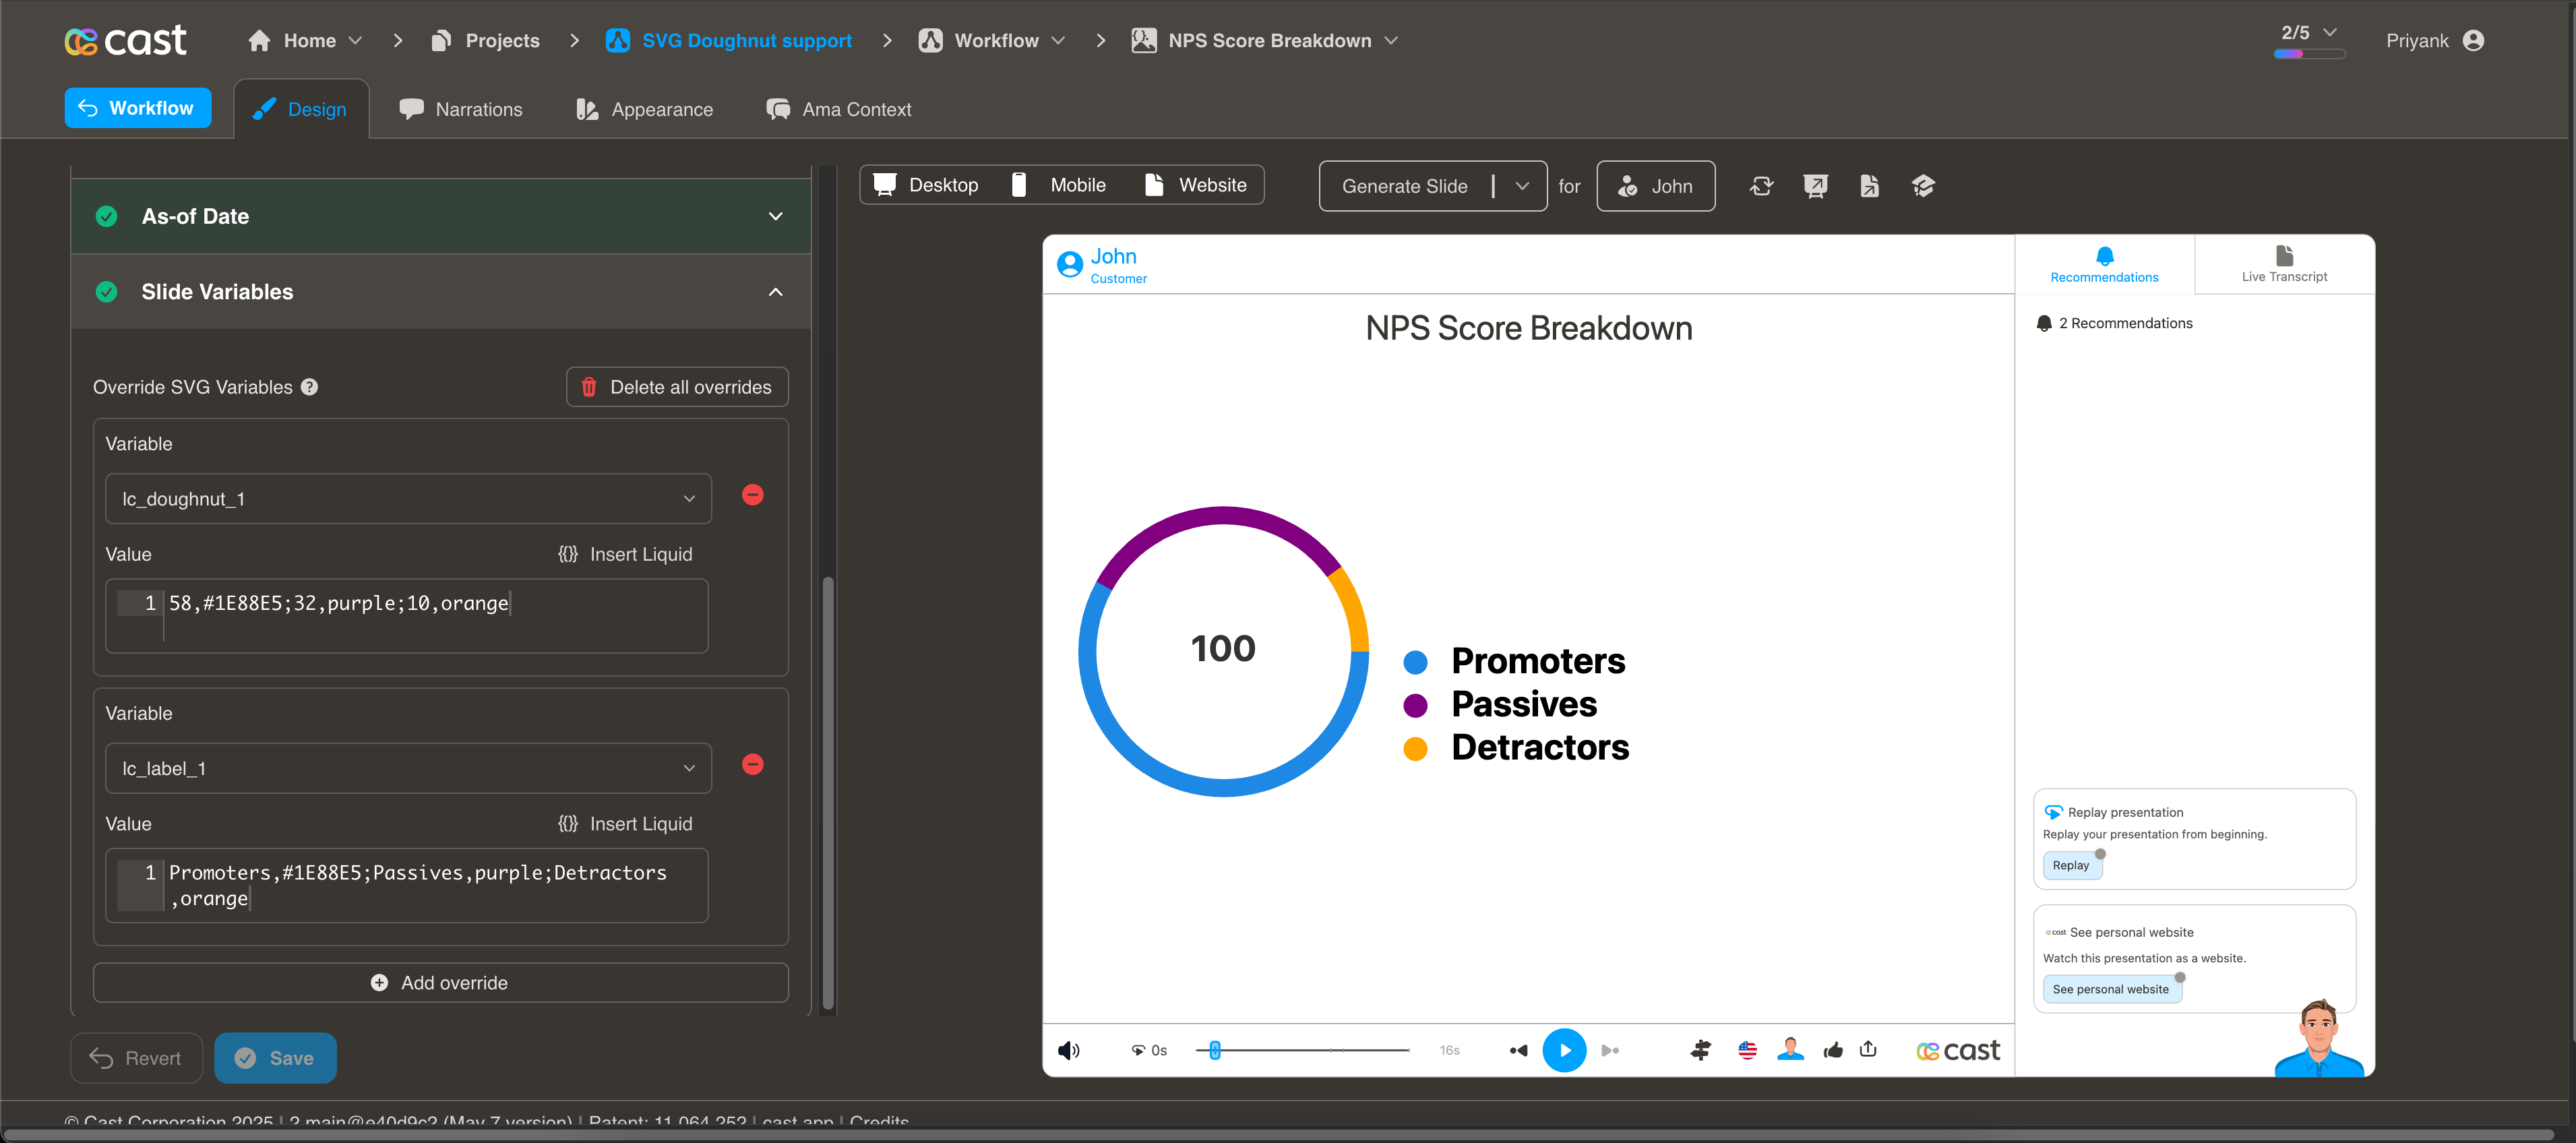
Input Format
Basic Format - Values Only:
58;32;10
Creates three segments: 58%, 32%, 10%
With Color Specification:
58,#1E88E5;32,purple;10,orange
Color Options
CSS names, hex values, or mixed. If no colors are specified, the system uses your project’s default color palette.
Value Processing
- Minimum value: 1 (segments require at least 1 to be visible)
- Zero values: Converted to 1
- Proportional: Values are automatically scaled to fill 100% of the circle
- Start position: Segments begin at 12 o’clock and progress clockwise
Usage Example
<!-- In your SVG -->
<circle id="lc_doughnut_nps" cx="200" cy="200" r="100" />
<text id="lc_label_nps-legend">Placeholder text</text>

<!-- In your dataset -->
{{ nps }} = "58,green;32,blue;10,red"
{{ nps-legend }} = "Promoters,green;Passives,blue;Detractors,red"
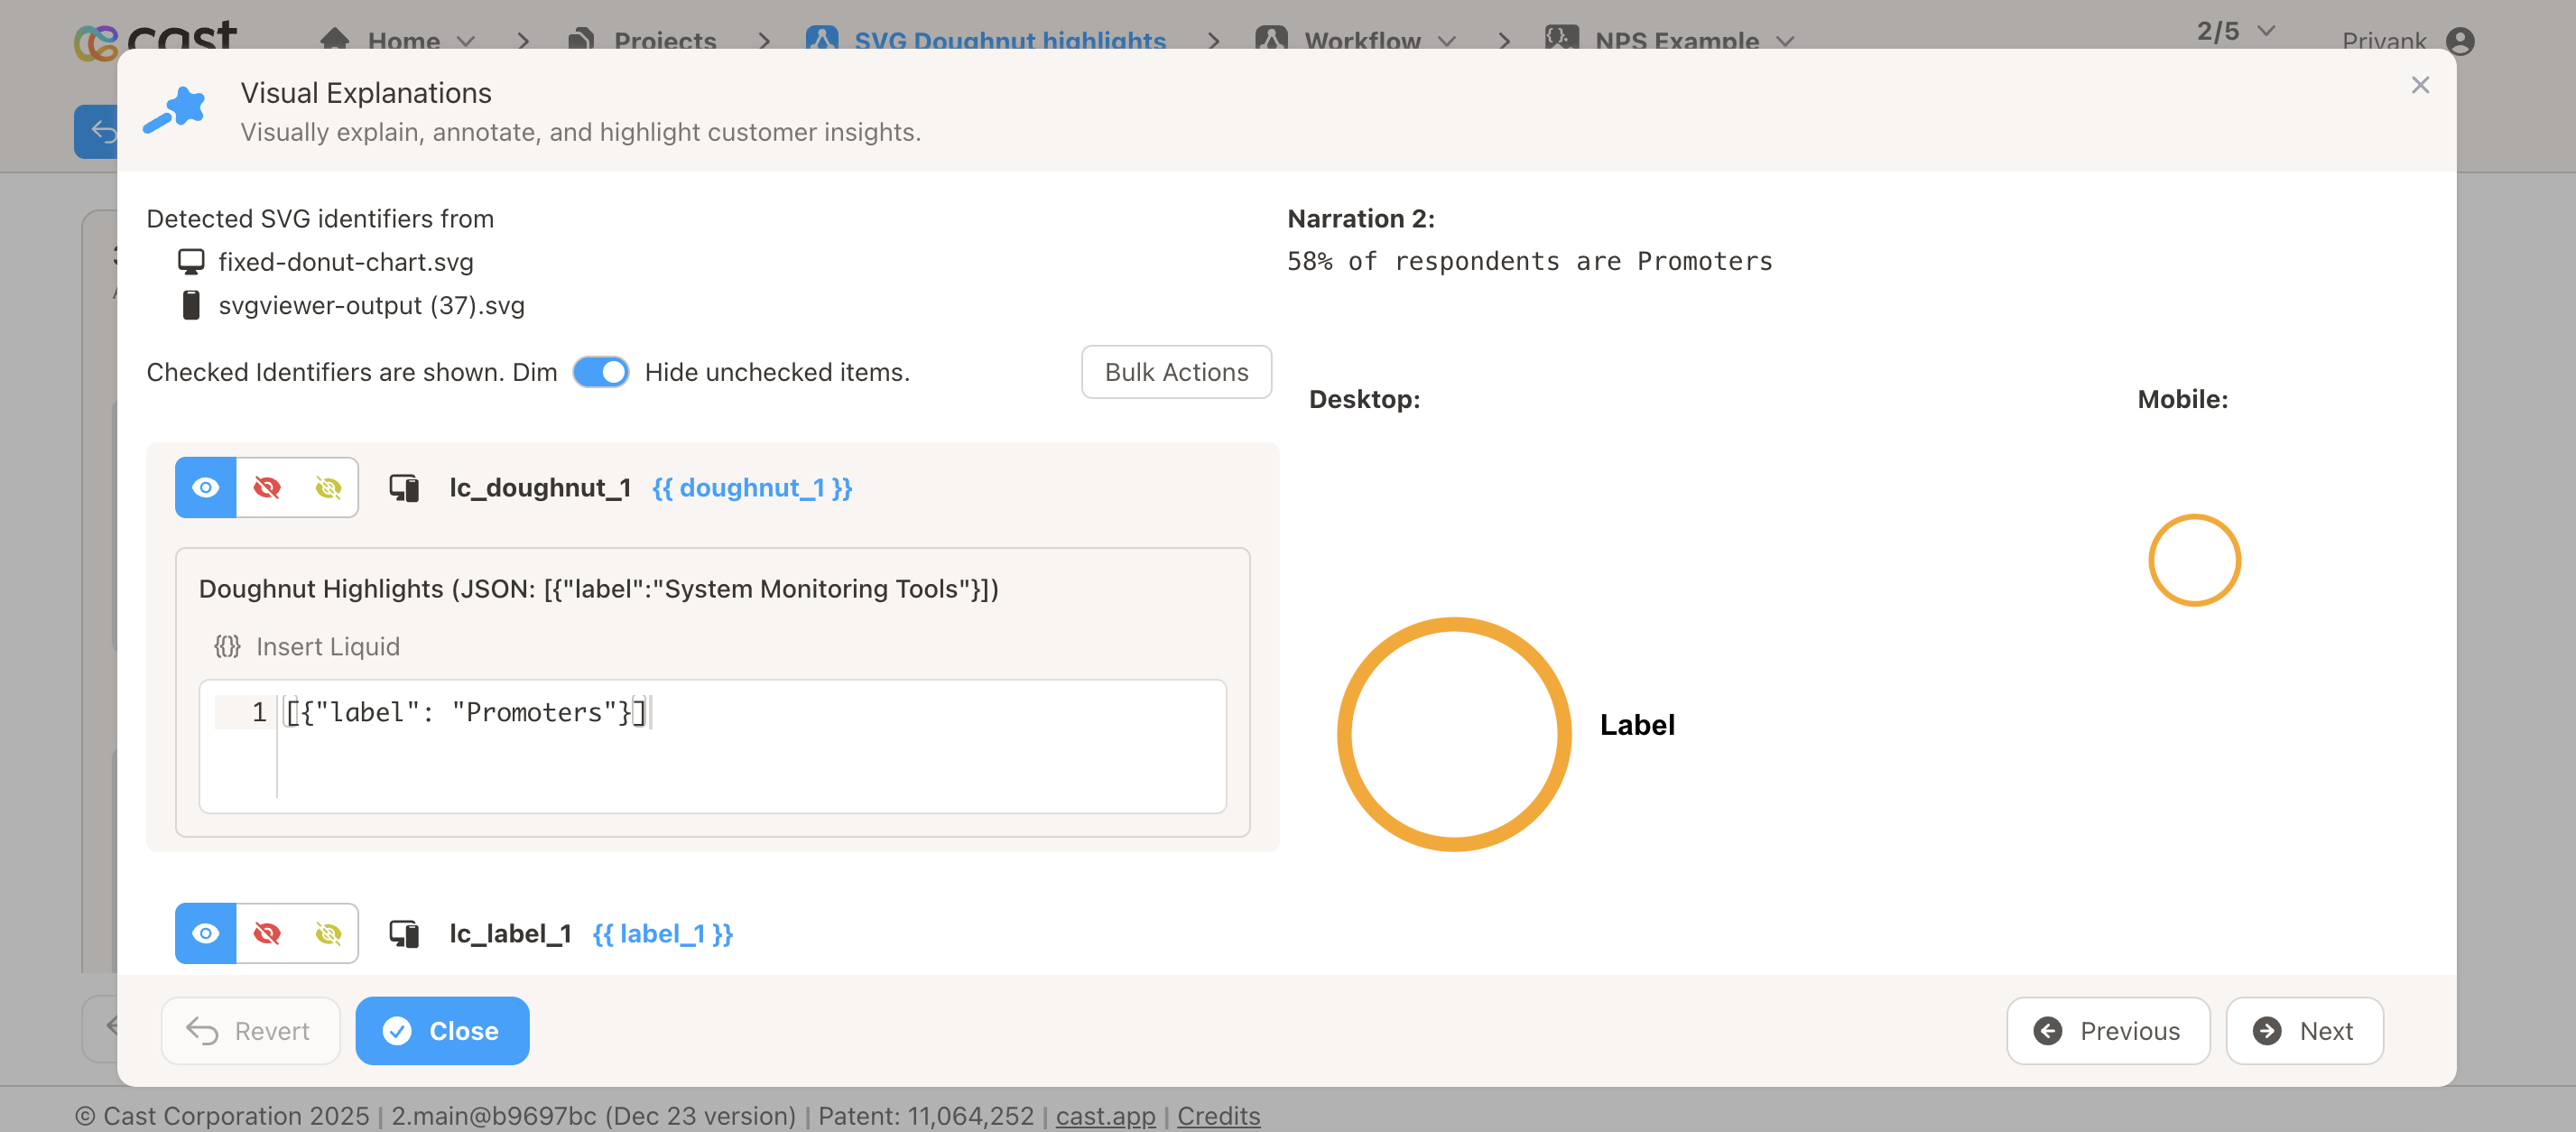
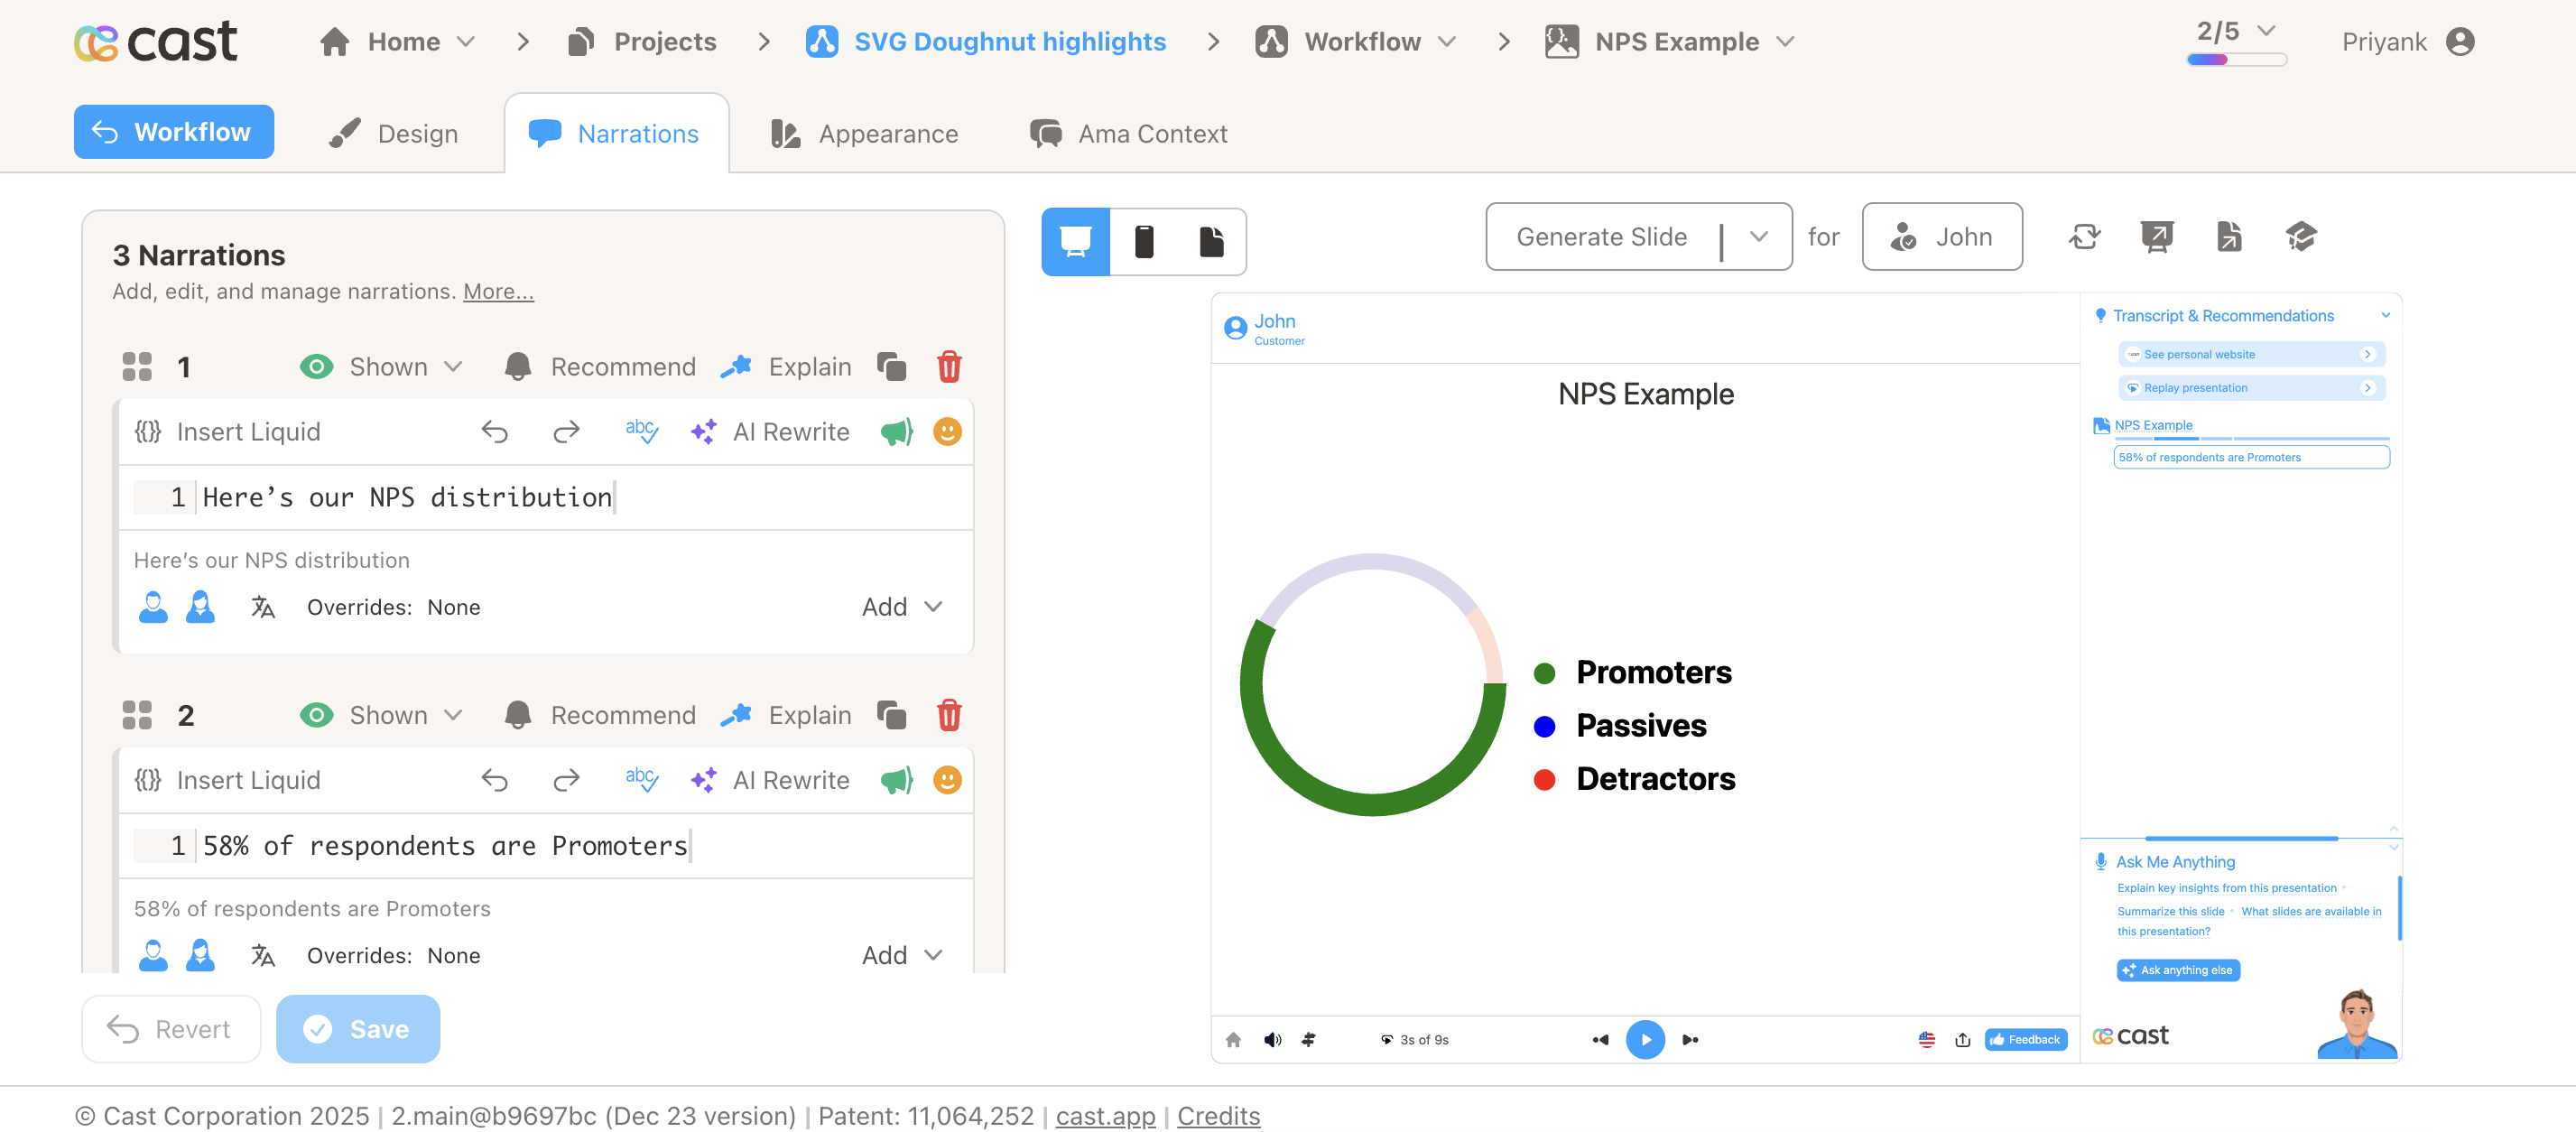
Highlighting Individual Segments
Doughnut charts support selective highlighting during your presentation. When you reference a segment’s label in your narration, that segment automatically highlights (full brightness with increased thickness) while other segments dim to about 12% brightness.
Highlight Format (in Cast Designer → Narration → Visual Explanations → liquid block):
- Single segment:
[{"label": "Rent"}] - Multiple segments:
[{"label": "Rent"}, {"label": "Food"}] - All segments visible: Don’t add any highlight to the liquid block
Labels can be embedded in the data (e.g. 5000,#FF5733,Rent;3000,#33FF57,Food) or provided via a companion lc_label_* element.