lc_heatmap_*
Visualize data intensity through color opacity. Perfect for showing performance metrics, engagement levels, or data density.
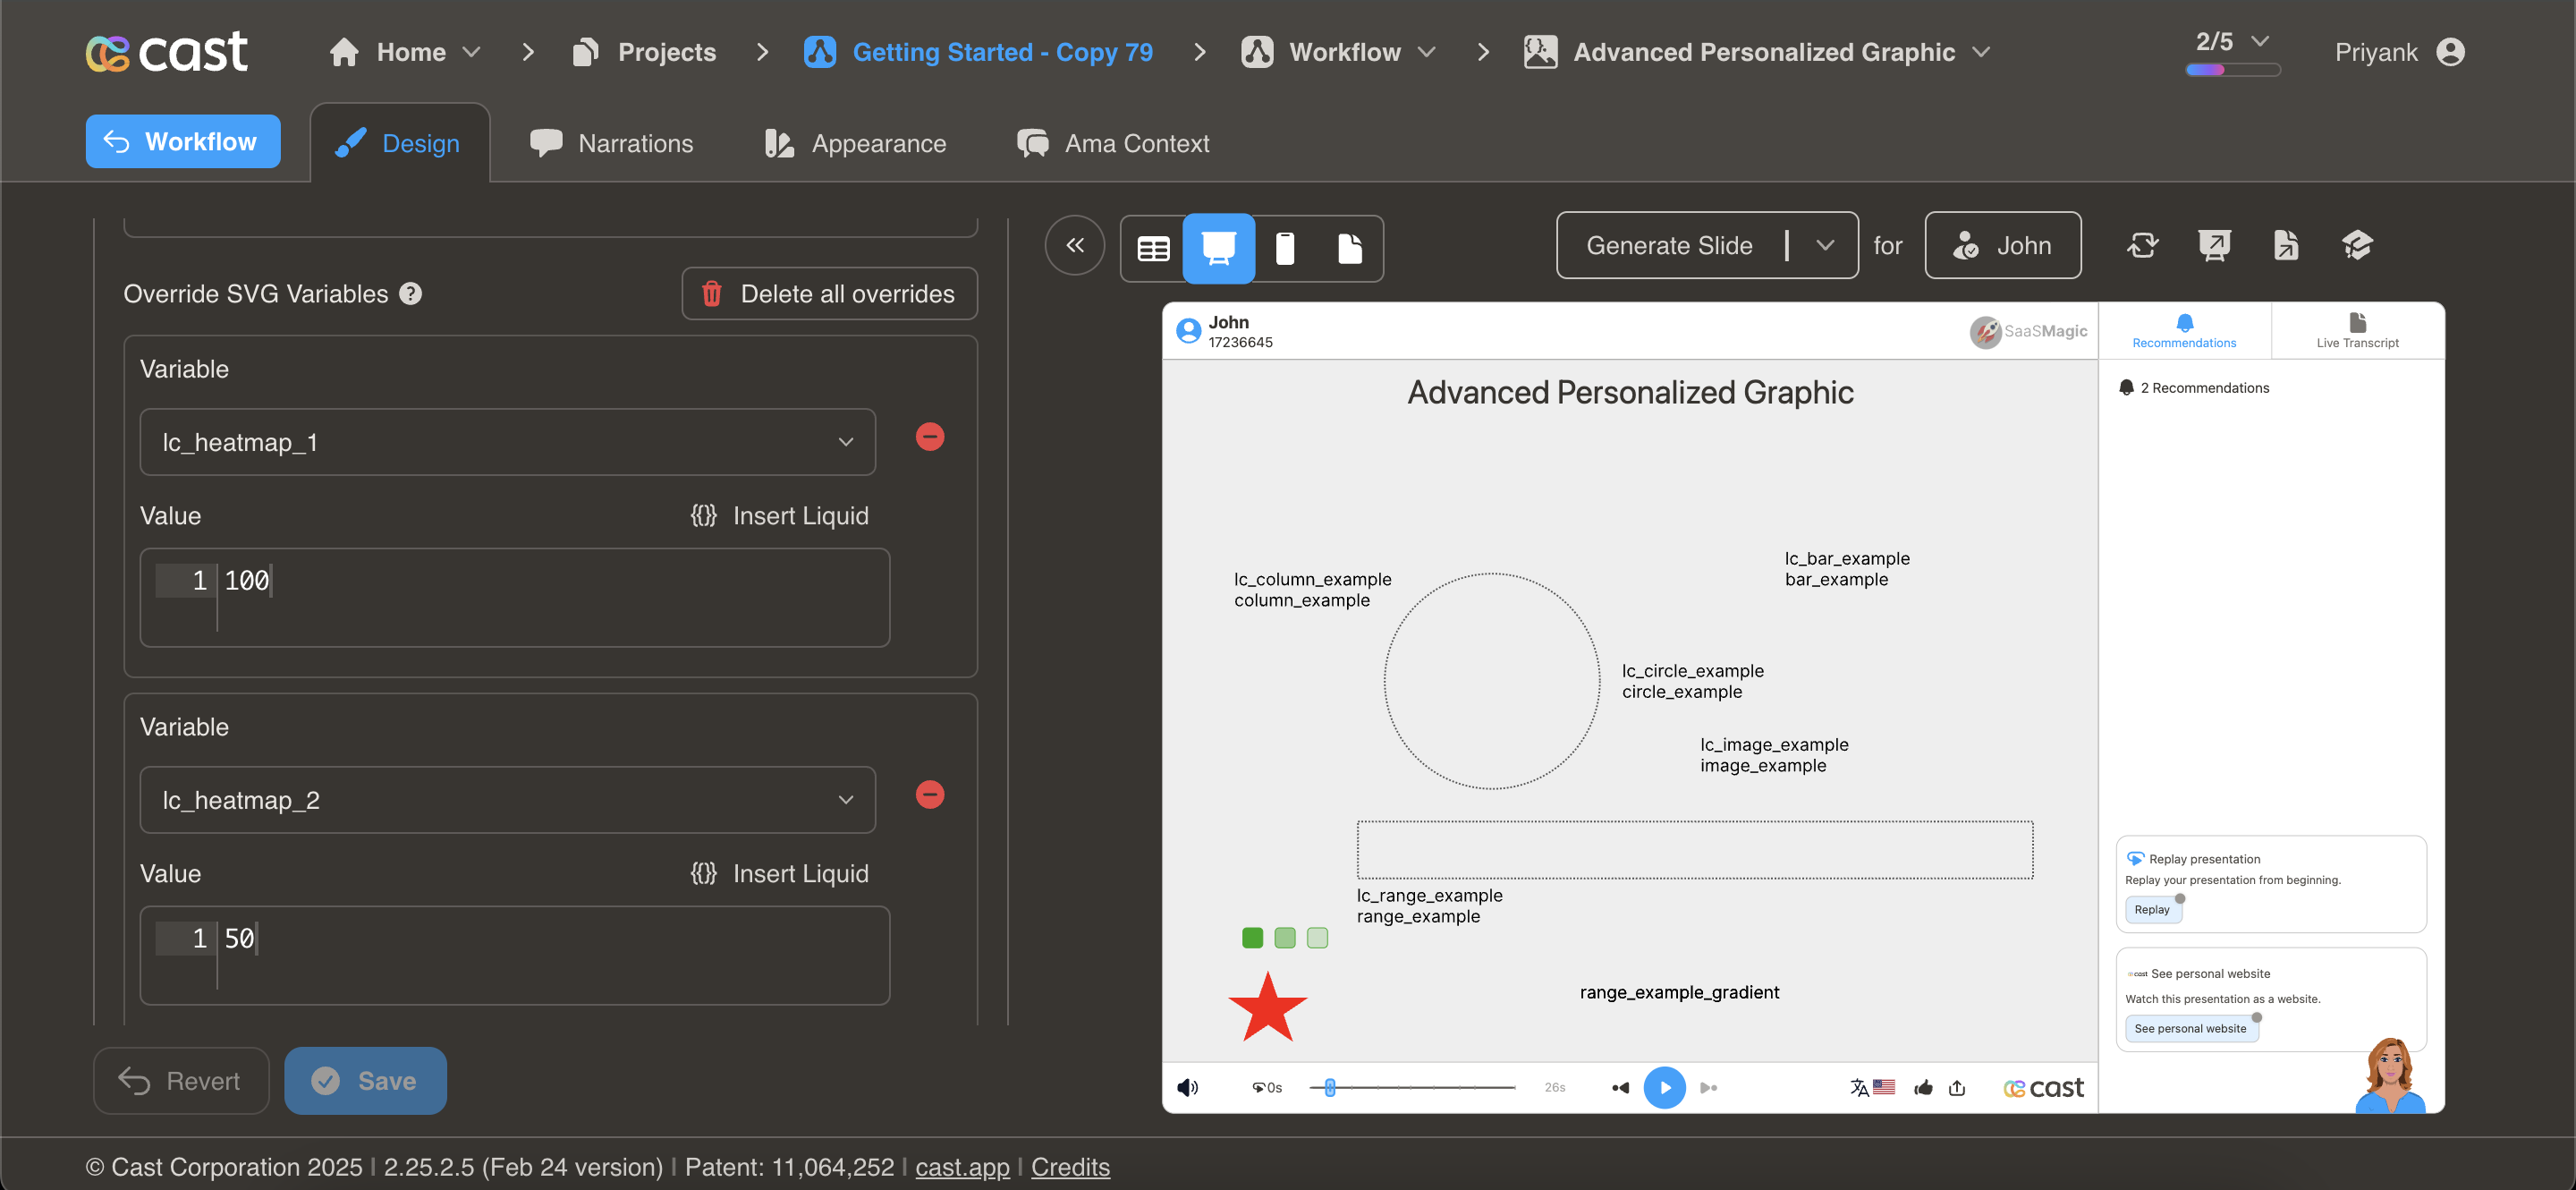
Element Setup
Target Element:
- Element type: Any SVG element
- ID format:
lc_heatmap_*(e.g.,lc_heatmap_engagement,lc_heatmap_score) - Required attribute:
dataFill(defines base color)
<rect id="lc_heatmap_q1" dataFill="#2196F3" />
Input Format
Percentage Value (0-100):
-
0 = Completely transparent 100 = Fully opaque - Values > 100 are treated as 100
Usage Example
<!-- In your SVG -->
<rect id="lc_heatmap_q1" dataFill="#2196F3" width="50" height="50" />
<!-- In your dataset -->
{{ q1 }} = "45"   <!-- 45% opacity -->