Design
The Design tab configures the slide’s visual content and data. It is where you define what the slide shows and how it is visualized.
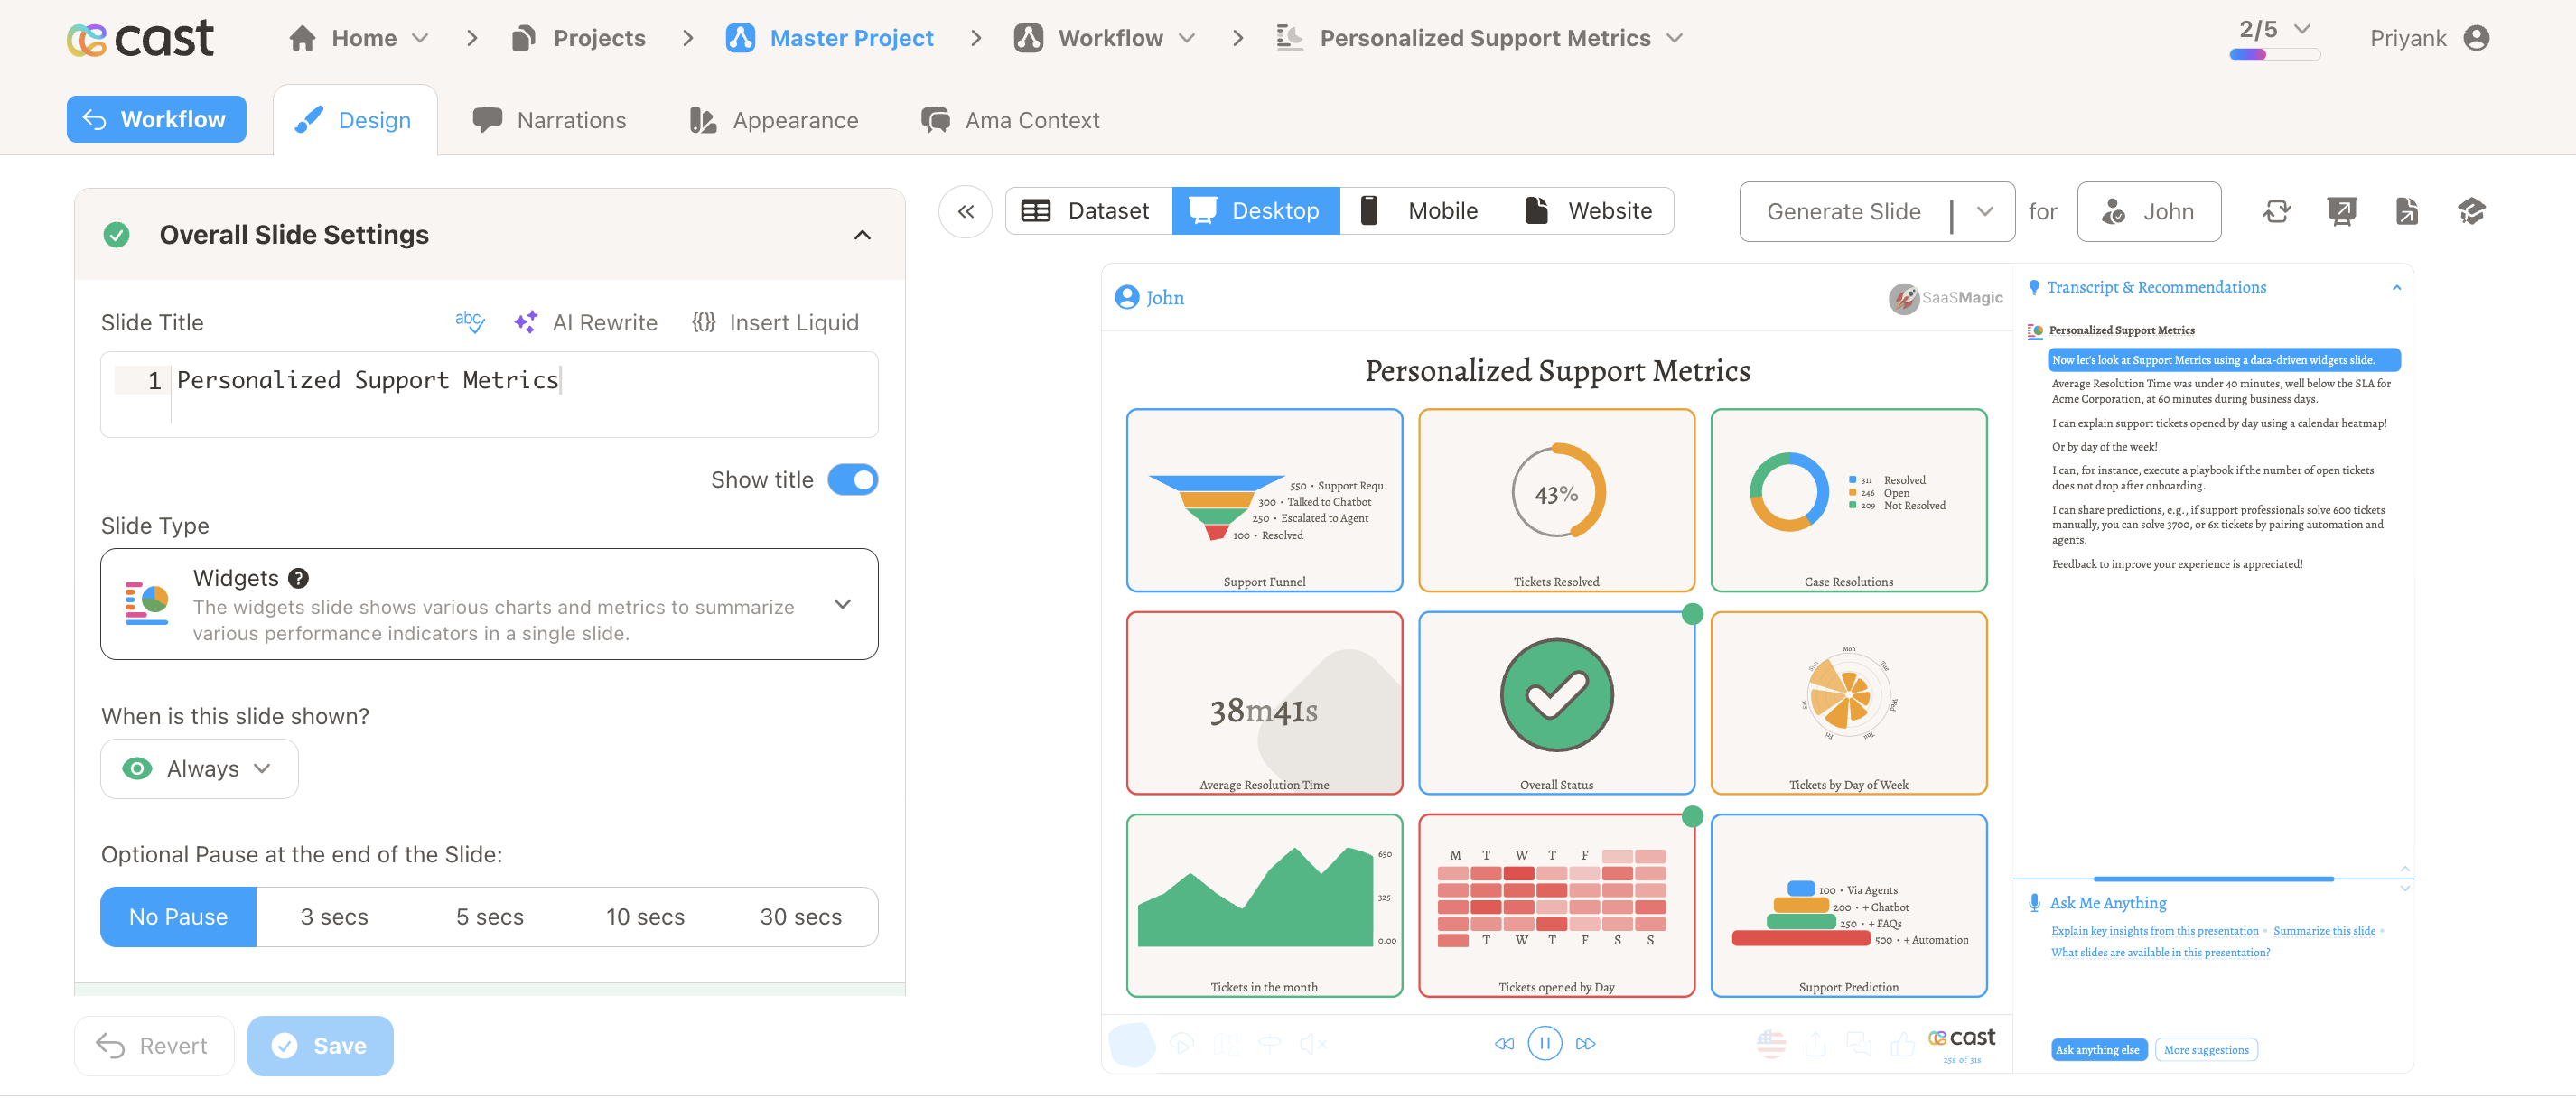
Overall Slide Settings
- Slide Title – The slide name. Supports Liquid variables for personalization (e.g. ` QBR`).
- Slide Type – Choose the visualization type: charts (bars, lines, funnels, etc.), editorial (welcome, video, form), navigation, widgets, or custom SVG.
- Slide Visibility – Add conditions to control when the slide is shown. Use expressions based on contact variables, fields, or snippets.
- Optional Pause – Add a pause at the end of the slide before advancing.
Slide Visibility
Control when this slide is shown using the dropdown under “When is this slide shown?”:
| Option | Description |
|---|---|
| Show Always | The slide is shown to all contacts. |
| Show Never | The slide is hidden from all contacts. Useful to temporarily disable a slide without deleting it. |
| Show Conditionally | The slide is shown only when your conditions are met. Opens the conditions modal to add rules. |
When you choose Show Conditionally, add one or more conditions based on contact variables, fields, or snippets. You can combine conditions with AND (all must be true) or OR (at least one must be true). Supported operators include equals (==), not equals (≠), greater than or equal (≥), less than or equal (≤), and contains.
For step-by-step instructions, see Conditional Presentations.
Optional Pause
Optional Pause at the end of the Slide keeps the slide on screen for a set duration after narrations finish, before advancing to the next slide. Useful for SVG slides, text-heavy slides, or data slides so viewers can read and absorb the content.
| Option | Duration |
|---|---|
| No Pause | Advances immediately when narrations finish |
| 3 secs | 3 seconds |
| 5 secs | 5 seconds |
| 10 secs | 10 seconds |
| 30 secs | 30 seconds |
Optional Pause is not available for Navigation slides.
Dataset
For data-driven slides, attach a dataset and map columns:
- Dataset – Select the dataset that provides the slide’s data.
- Contact Mapping – Map dataset columns to contact variables for personalization.
- Column Mapping – Map columns to chart segments, labels, or values.
Chart and Visualization Settings
Settings vary by slide type:
- Segments – Configure data segments, colors, labels, and formatting.
- Chart Options – Layout, axes, legends, and chart-specific options.
- As-of Date – Set the date context for time-based data.
Video Slides
For video slides:
- Video Segments – Add segments with uploaded videos or CDN links.
- Orientation – Configure aspect ratio (landscape, portrait, square).
- Source – Upload files or use existing CDN URLs.
Related
- Slide – Overview of slide editor tabs
- Slide Types – Available visualization types
- Narrations – Add voice to your slide
- Appearance – Override slide appearance
- AMA Context – Add AMA context for this slide