Time-Based Visualization with lc_days_of_month_*
lc_days_of_month_* is a prefix used for the IDs of SVG elements that need to display day-by-day data across a month, ideal for showing activity patterns, performance metrics, and temporal trends in a calendar-style layout.
Use Cases
- Monthly trends and performance tracking
- Daily activity patterns across the month
- Monthly business intelligence and reporting
- Long-term trend analysis and forecasting
- Monthly operational metrics and KPIs
Element Identification
The target element must be a <rect> with an ID that starts with lc_days_of_month_*.
Input Format
The input value must be provided as a JSON array of objects, where each object represents a single day within the month.
JSON Format
A JSON string containing an array of objects with the following structure:
[
  {
    "value": "250",
    "name": "2023-01-01",
    "color": "#4CAF50",
    "labelColor": "#333333",
    "showHeader": true
  },
  {
    "value": "280",
    "name": "2023-01-02",
    "color": "#FF9800"
  },
  {
    "value": "320",
    "name": "2023-01-03",
    "color": "#F44336"
  }
]
Dataset/CSV Format
Alternatively, you can use tabular data from your datasets with the following columns.
name is a calendar date. Add optional showHeader only when you want Mon–Sun in a row across the top; use true on the first date of that month.
| name | value | title | chartColor | labelColor | showHeader |
|---|---|---|---|---|---|
| 2025-08-01 | 45 | August sample | #4285F4 | #333333 | true |
| 2025-08-02 | 62 | August sample |
Additional columns:
color: Individual element colorsshowHeader: Shows weekday names in a row across the top of the month (use on the first row for that month)
Dataset Usage:
- Connect your time-based chart to a dataset containing the required columns
- The system will automatically map the columns to the appropriate chart properties
- Filter data by time ranges or other criteria to show relevant time-based charts
- Multiple rows create a multi-day series for monthly visualization
Important Notes:
- Column names must match exactly as shown in the example (
value,name,title,chartColor,labelColor, plus optionalshowHeader) - Column names are case-sensitive and must be spelled exactly as specified
- If data is not passed in the correct format or column names don’t match, the element will display as a plain
<rect>without any time-based visualization - The
namefield must contain valid date strings for proper temporal ordering
Implementation Steps for Dataset Usage
To use dataset/CSV format with time-based charts, follow these steps:
Create Dataset: Import your data containing the required columns (value, name, title, chartColor, backgroundColor, labelColor, and optionally showHeader)
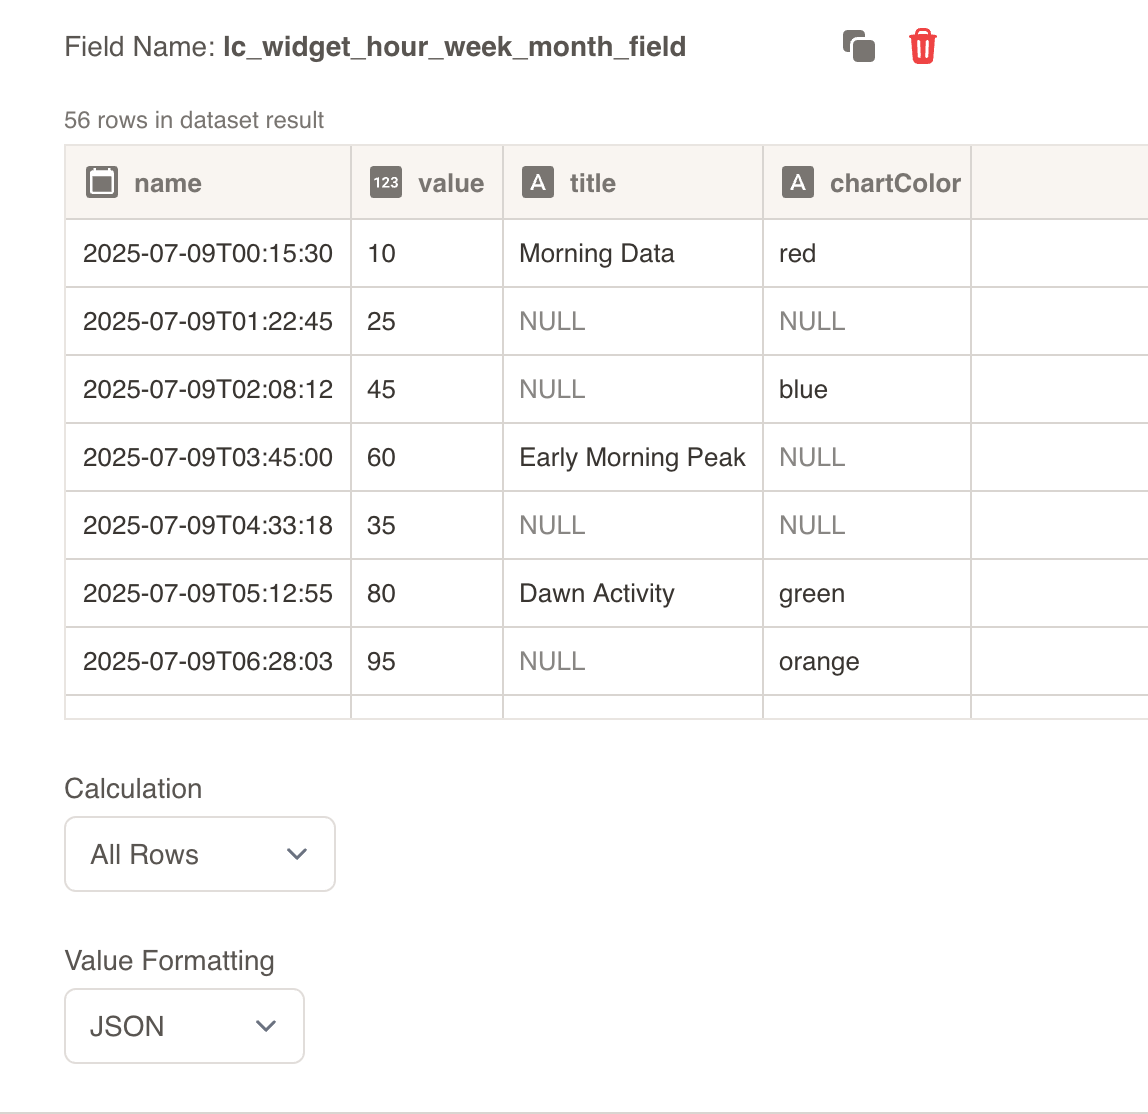
Create Field: Create a field from your dataset that contains the time-based chart data
Set Value Formatting: In the field settings, set Value Formatting to “JSON” - this is crucial for proper data formatting
Override SVG Variables: In the SVG slide design tab, go to “Override SVG Variables”
Select Variable: Choose your time-based chart variable and use the format:
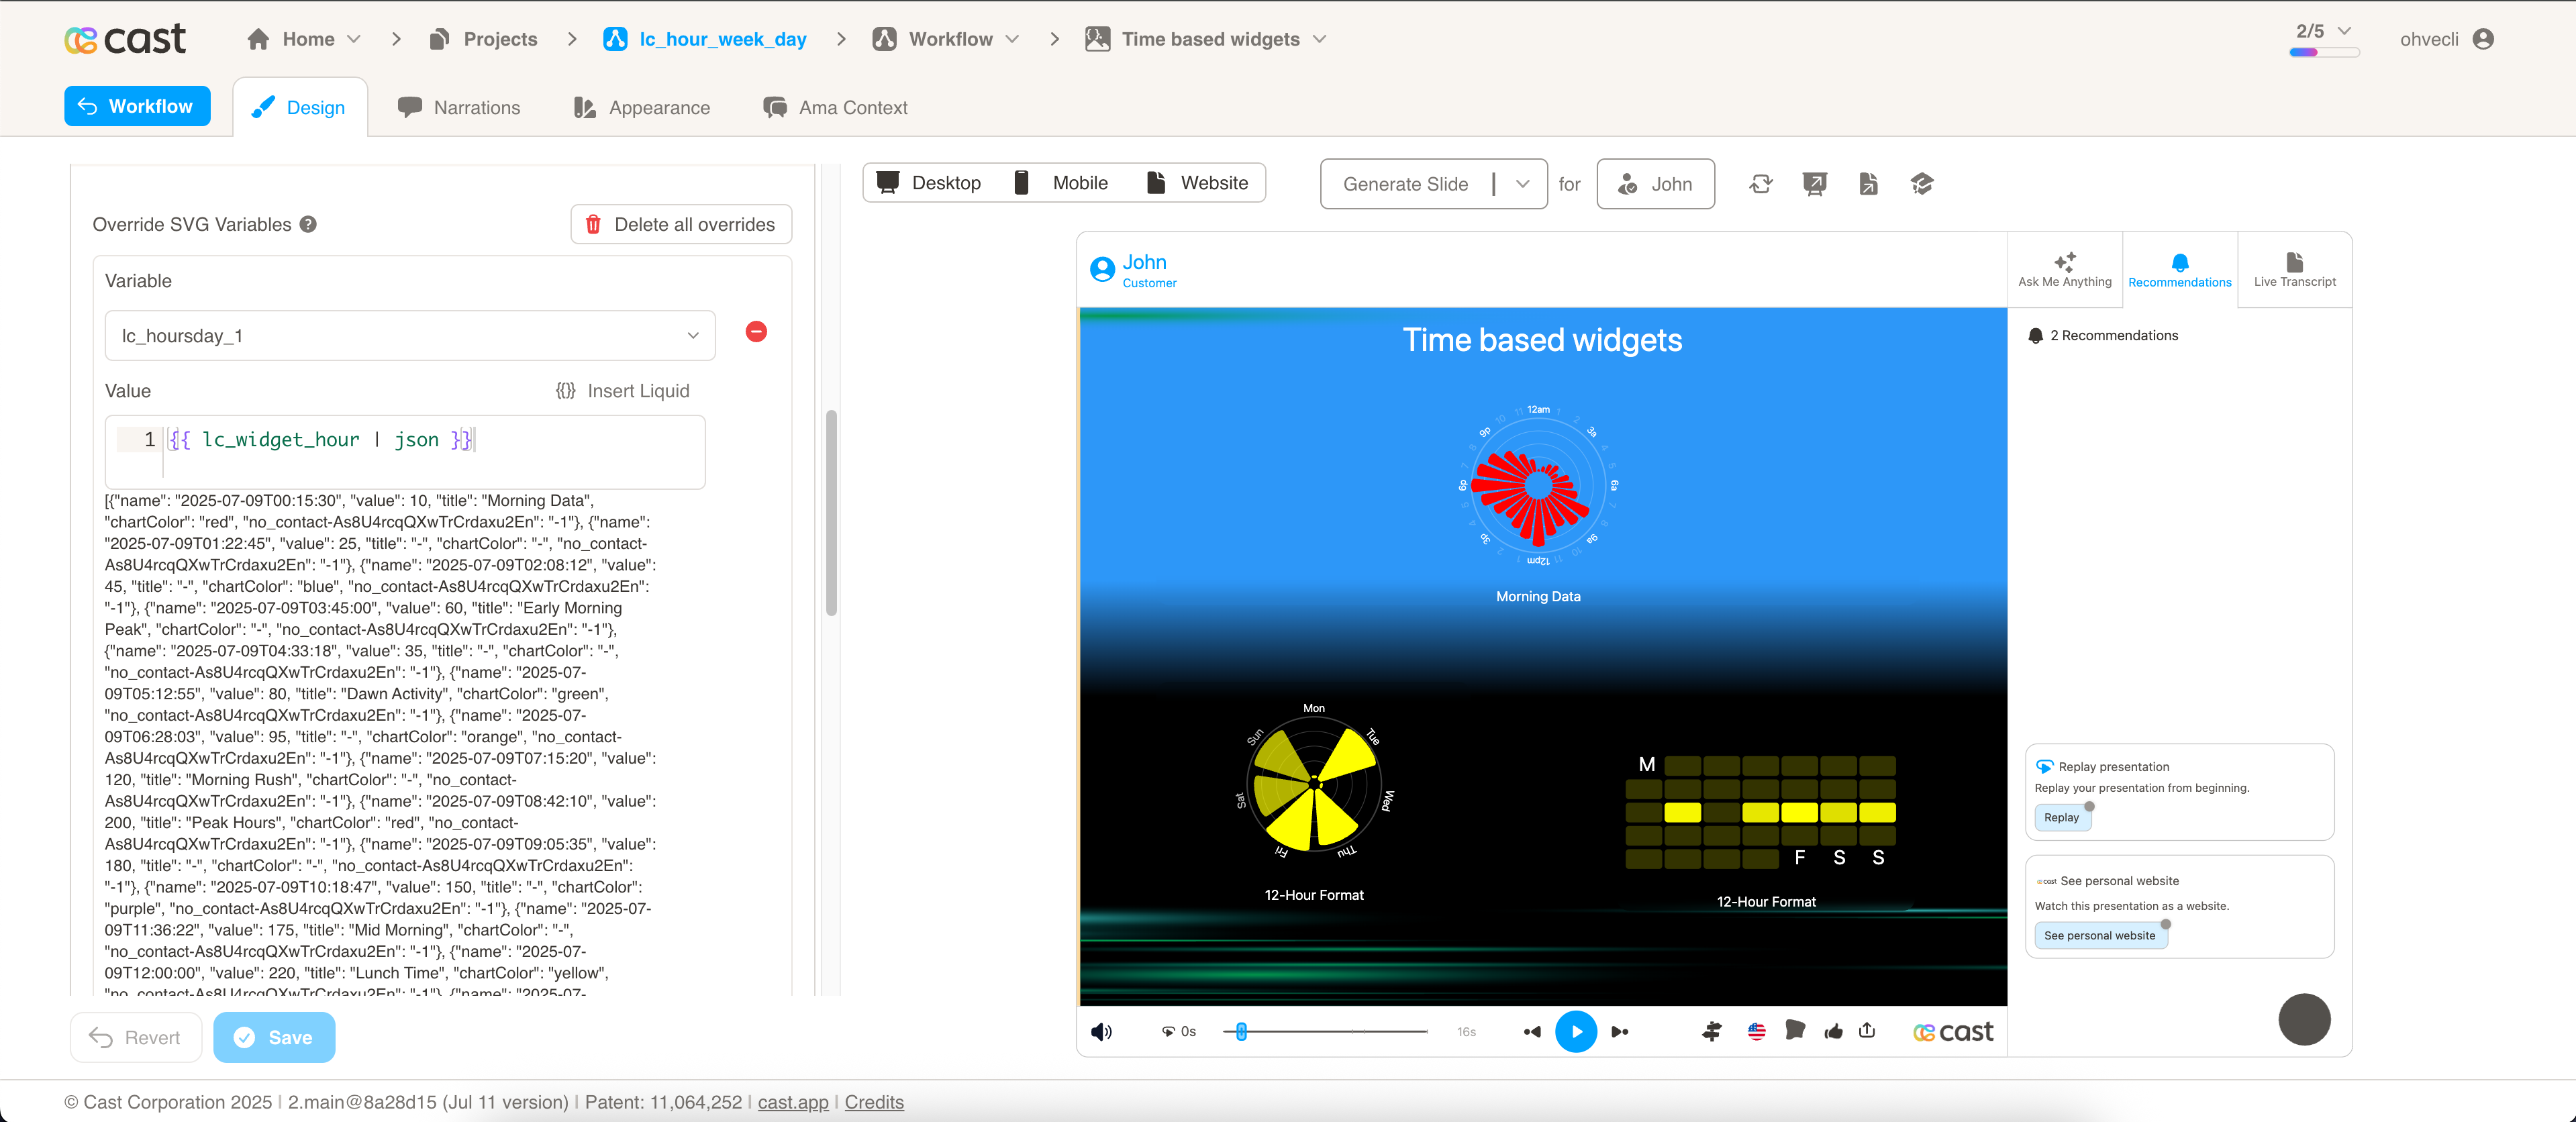
Include JSON Filter: Critical: Always include the | json filter with your field, otherwise the time-based chart will not work
Configuration Properties
Required Properties:
value: Numeric value for the data point (mandatory)name: Date string for temporal positioning (mandatory)
Optional Properties:
title: Text title for the chart (optional)chartColor: Color specification for chart elements (optional)labelColor: Color for text labels (optional)color: Custom color for individual elements (optional)showHeader: Weekday names in a row across the top of the month (optional)
Additional Properties for lc_days_of_month:
When using lc_days_of_month_* in direct SVG slides (not widgets), additional properties are available:
color: Custom color for individual day cells (e.g.,"#FF5722","red")labelColor: Color for weekday headers, month caption, and day numbersshowHeader: Lets you choose how weekday names (Mon–Sun) appear on the month calendar. Set totrueon the first day in your data to show those names in one row above the days—helpful when you want a clean, calendar-style header. Leave it out (or set tofalse) to keep the usual layout, where weekday names appear around the edges of the grid instead.
Color Specifications
Single Color:
- Provide a single color value:
"red","#FF0000" - Uses CSS color names or hex values
Color Priority and Behavior:
- First Object Rule: The system will only use the
chartColorfrom the first object in the JSON array - If the first object has a
chartColorspecified, that color will be used for the entire visualization - If the first object does not have a
chartColor(or it’s empty), the system will fall back to appearance settings and project color palette chartColorvalues in subsequent objects (second, third, etc.) are ignored
Default Behavior:
- If no color is provided in the first object, colors will be taken from the appearance settings and Color Palette
- This ensures consistency with your overall design palette