lc_label_*
Create labeled lists with optional colored bullets. While commonly used with doughnut charts, labels operate independently and work with any visualization.
Element Setup
Main Element:
- Element type:
<text> - ID format:
lc_label_*(e.g.,lc_label_legend,lc_label_categories)
Input Format
Basic Format - Labels Only:
{"items":[{"label":"Onboarding"},{"label":"Renewal"},{"label":"Expansion"}]}
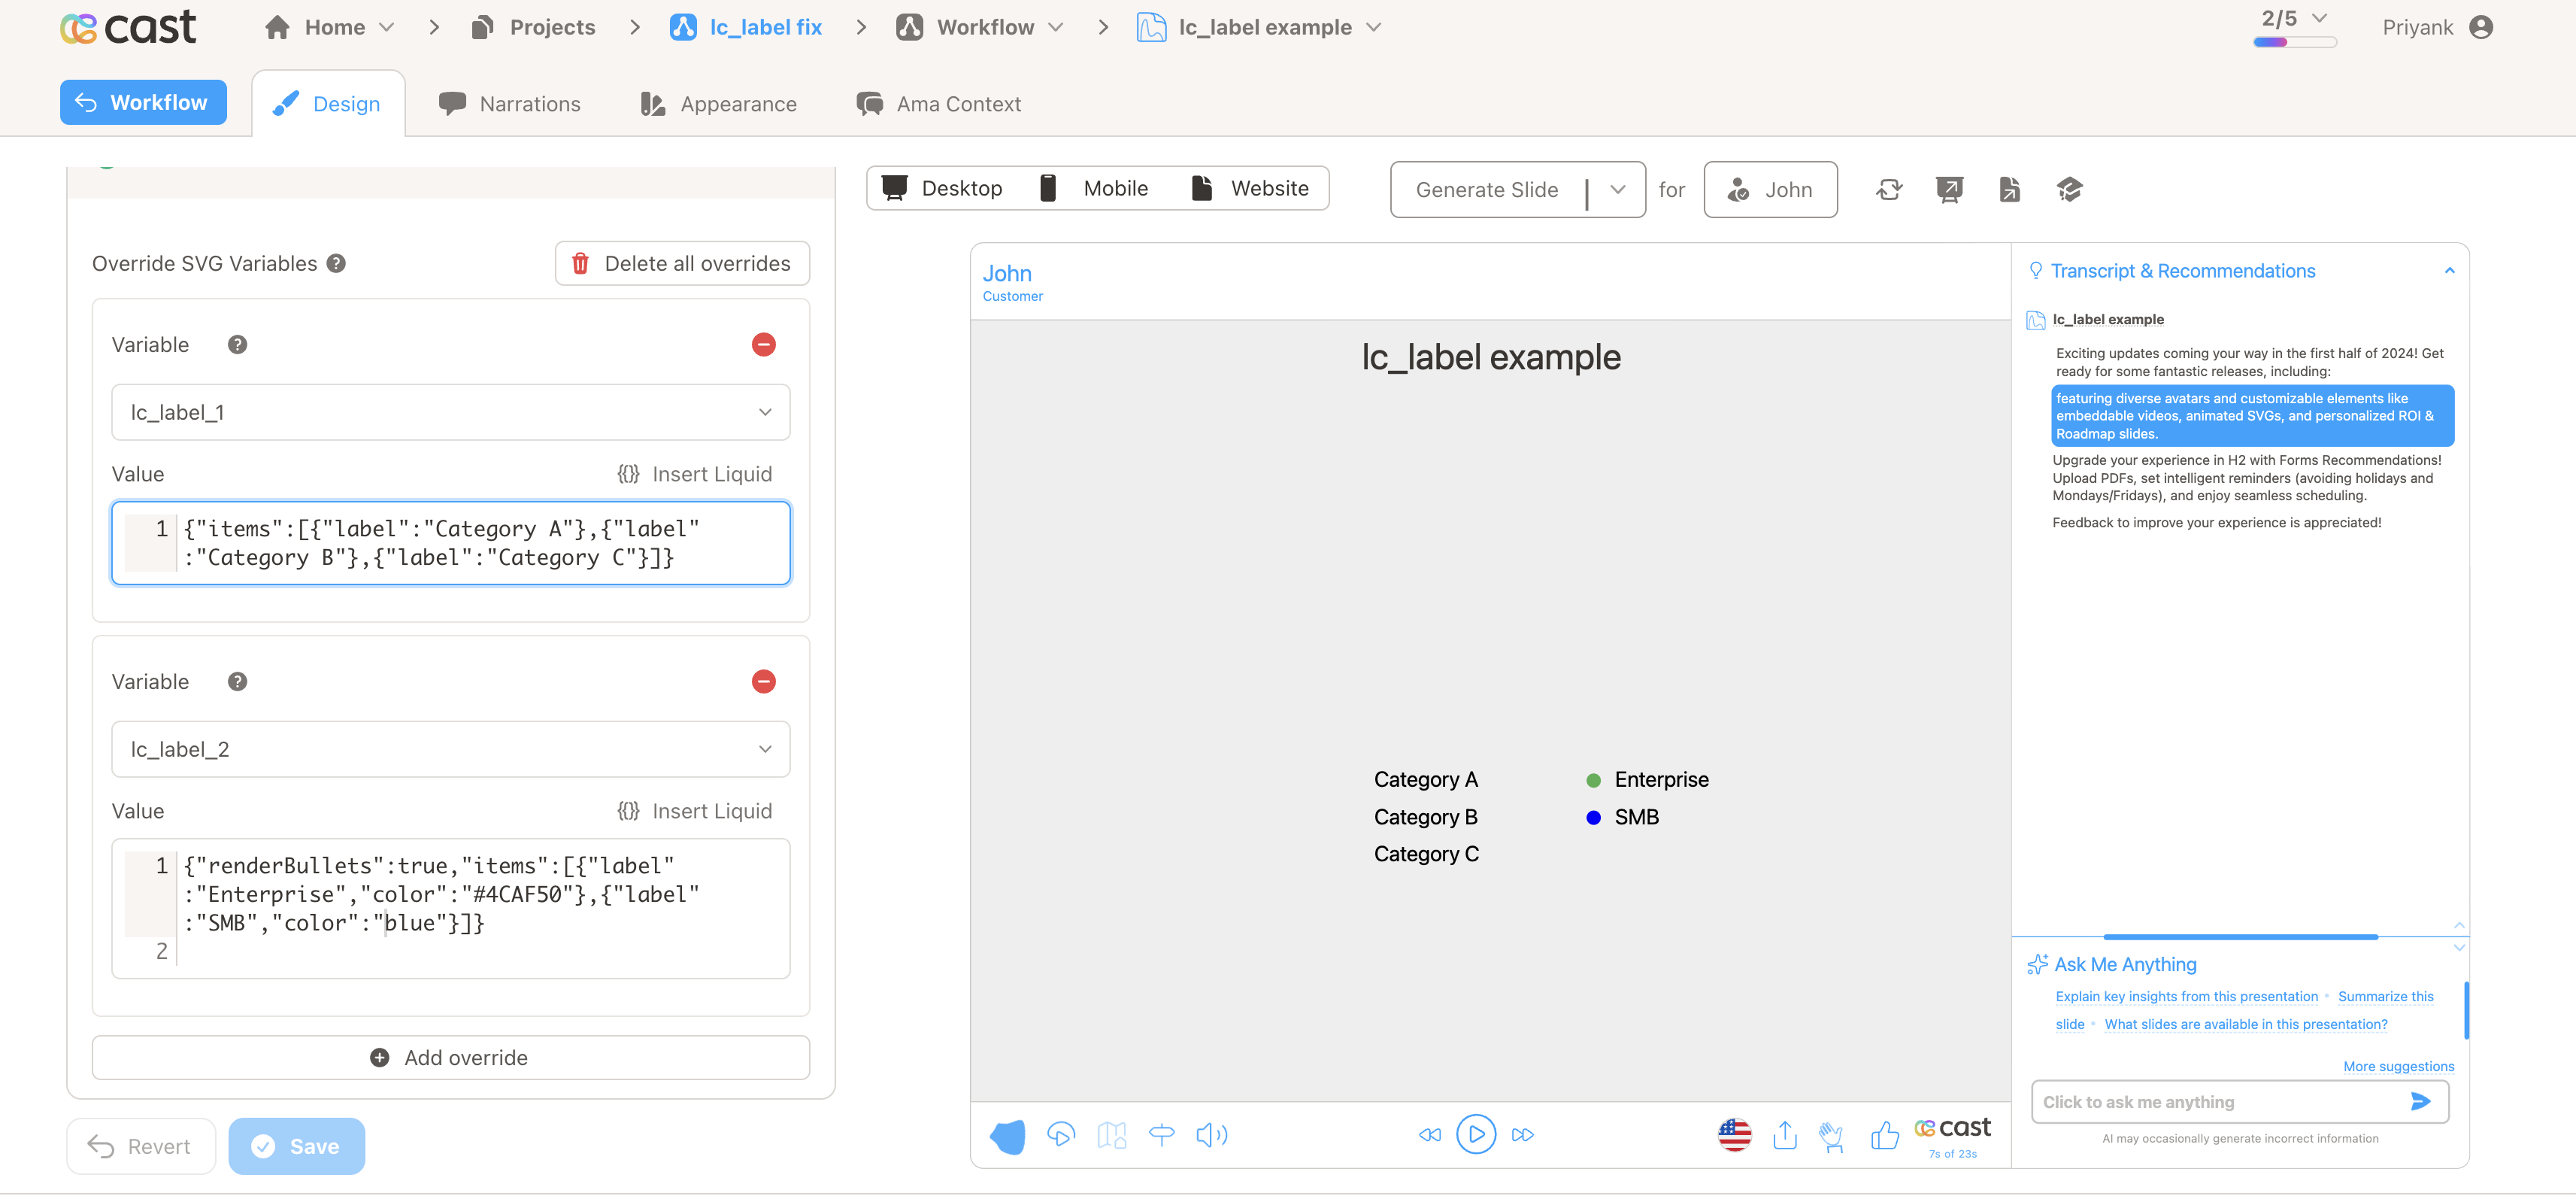
With Colored Bullets:
{"renderBullets":true,"items":[{"label":"Enterprise","color":"#4CAF50"},{"label":"SMB","color":"blue"}]}
With Word Wrapping (maxChars sets the line width):
{"maxChars":20,"items":[{"label":"A long category name","color":"green"},{"label":"Another long one","color":"red"}]}
Options
renderBullets: show colored bullets next to each labelmaxChars: wrap long labels at this character countitems[].color: optional hex or CSS color; left blank, the project palette fills in
Legacy semicolon format (e.g. Label1,color1;Label2,color2) still works but is deprecated — prefer JSON.
Color Options
Named colors or hex values. If colors are omitted, uses project’s default color palette.
Usage Example
<!-- In your SVG -->
<text id="lc_label_nps-scores" x="50" y="100" font-size="16">
  Placeholder text
</text>

<!-- In your dataset -->
{{ nps-scores }} = '{"renderBullets":true,"items":[{"label":"Promoters (9-10)","color":"green"},{"label":"Passives (7-8)","color":"blue"},{"label":"Detractors (0-6)","color":"red"}]}'
Result: Three labeled items with colored bullets matching colors
Common Use Cases
- Doughnut chart legends
- Status indicators
- Product categories
- Survey responses