
Analytics
Analytics
Section titled “Analytics”Campaign metrics appear in two places:
- On the campaign card on the Campaigns list — generation progress, speech caching, and email delivery counts (quick operational snapshot).
- On the Analytics tab — the full engagement dashboard (Overview + Details) scoped to that campaign.
This page explains every metric in both places. To compare multiple campaigns or open Analytics from Workflow → Analytics, see the Analytics guide.
Metrics on the campaign card
Section titled “Metrics on the campaign card”Each campaign on the Campaigns list shows one or more metric badges. Expand a badge to see individual counts. Click a metric to open a contact list or event detail modal.

Generation badge
Section titled “Generation badge”Tracks how many presentations were created for this campaign.
| Metric | What it means | Click action |
|---|---|---|
| Contacts | Total contacts targeted for generation in this campaign | Opens the contact preview list |
| Generated | Presentations successfully created | Opens the generated contact list |
| Skipped | Contacts skipped by generation rules or conditions | Opens the skipped contact list (download available) |
| Errors | Contacts where generation failed | Opens the error list (download available); shown in red when > 0 |
The badge donut chart shows the split between Completed (green), Failed (red), and Skipped (orange) as a percentage of total contacts.
While generation is still running, the badge shows a progress indicator.
Speech badge (when TTS is enabled)
Section titled “Speech badge (when TTS is enabled)”Shown when text-to-speech caching is enabled for the project. Tracks narration audio being prepared before or during delivery.
| Metric | What it means |
|---|---|
| Narrations | Total narrations in the campaign |
| Voices | Number of distinct voices used |
| Voice Narrations | Total voice narrations that need to be cached |
| Pre-Cached | Narrations already in cache before this run |
| Caching | Narrations currently being cached (in queue) |
| Caching completed | Narrations successfully cached in this run |
| Failed | Narrations that failed to cache (shown in red when > 0) |
Delivery badge
Section titled “Delivery badge”Shown after email delivery has been scheduled or completed. Tracks email send and engagement for this campaign only. Counts are totals (not unique contacts).
| Metric | What it means | Click action |
|---|---|---|
| Generated | Presentations generated (same as Generation badge) | Opens generated contact list |
| Sent | Emails attempted — includes processed, failed, and dropped | Opens sent-email event modal |
| Delivered | Emails successfully delivered to the recipient’s inbox | Opens delivered-email event modal |
| Not Delivered | Emails that did not reach the inbox (failed + dropped + bounced) | Opens not-delivered event modal |
| Failed (under Not Delivered) | Pre-validation failures before send | Opens failed-email event modal |
| Dropped (under Not Delivered) | Blocked before delivery (spam, unsubscribed, invalid, or previously bounced) | Opens dropped-email event modal |
| Bounced (under Not Delivered) | Delivery failed after the email was sent | Opens bounced-email event modal |
| Opened | Email open events | Opens open-event modal |
| Clicked | Link clicks in the email body | Opens click-event modal |
The delivery donut chart shows Delivered (green) vs Not Delivered (red) as a percentage of emails sent.
Campaign card vs Analytics tab: The card shows generation and email delivery totals only. It does not show plays, recommendations, feedback, funnel stages, journey navigation, device/language breakdown, or unique counts. Use the Analytics tab for those.
Reminder badges
Section titled “Reminder badges”If the campaign has delivery reminders configured, each reminder appears as its own badge showing whether that reminder has completed, is in progress, or is scheduled.
Analytics tab
Section titled “Analytics tab”The Analytics tab opens the full Analytics page with this campaign pre-selected in the filter. You get the same Overview dashboard and Details grid used across all campaigns — scoped to the campaign you opened.
How to get there
Section titled “How to get there”- Open your Cast project.
- Hover the Workflow breadcrumb and click Campaigns.
- Click the campaign you want to analyze.
- Click the Analytics tab (alongside Edit Email and Deliver).
The Overview view opens by default.
Overview dashboard
Section titled “Overview dashboard”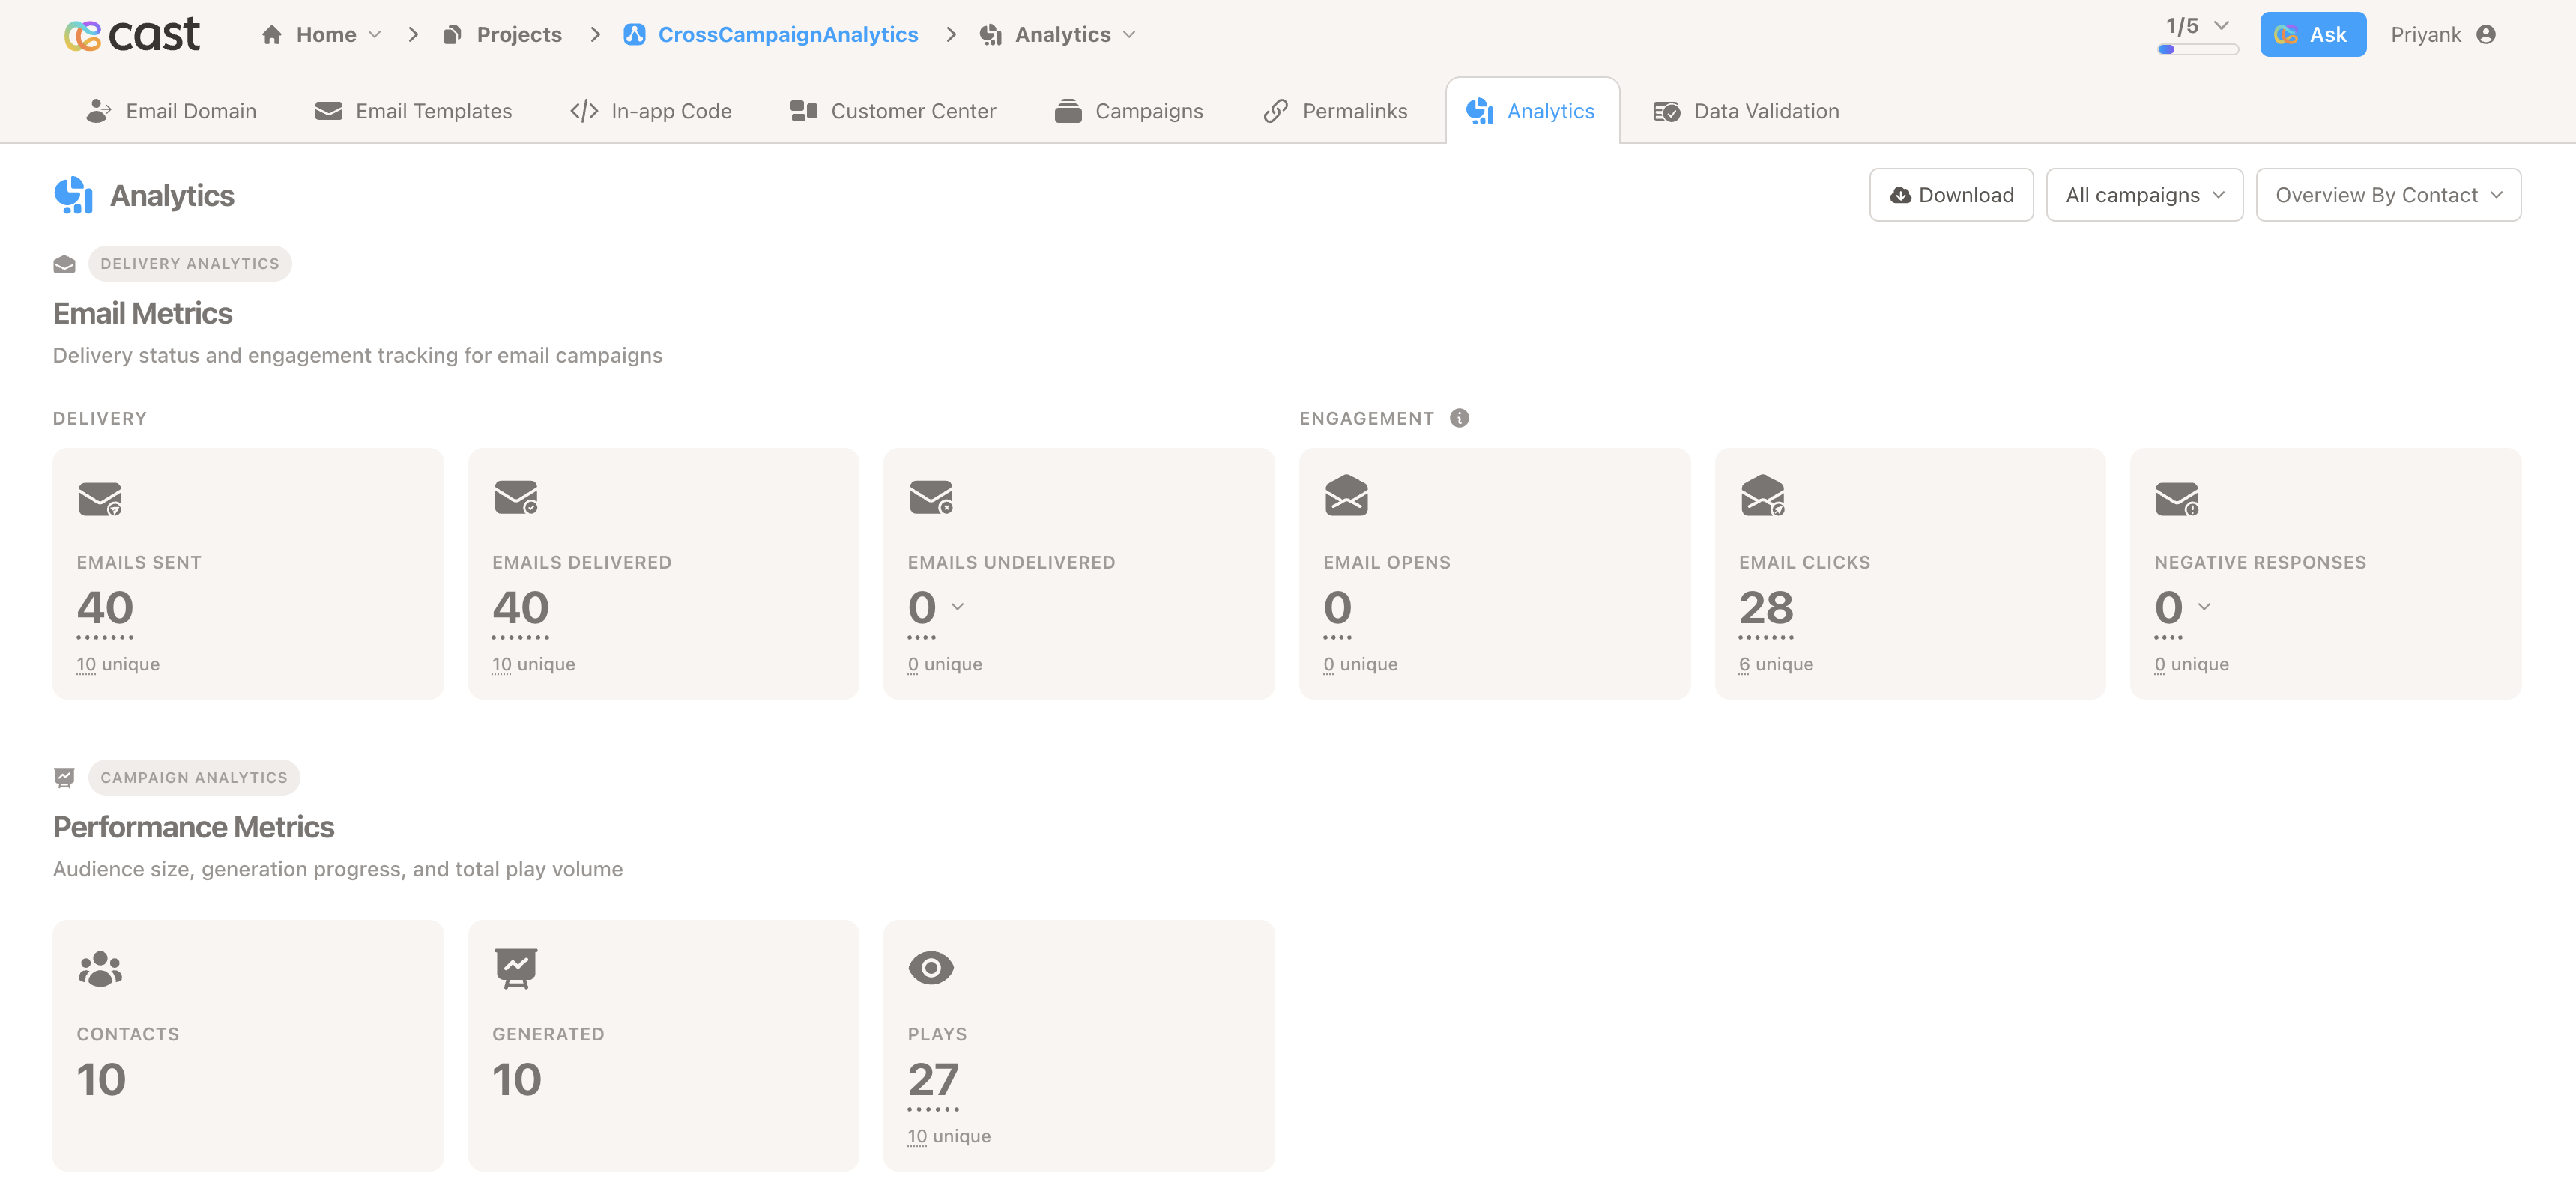
Switch between Overview and Details from the Viewing menu at the top of the page.
Email delivery
Section titled “Email delivery”Email metrics for the selected campaign. Each metric shows a total count with a smaller unique count underneath (unique contacts or accounts who had that event).
| Metric | What it means |
|---|---|
| Sent | Emails queued or attempted for delivery |
| Delivered | Successful inbox deliveries |
| Not Delivered | Failed, dropped, or bounced emails (expand for breakdown) |
| Opens | Email open events |
| Clicks | Link clicks in the email |
| Negative Responses | Unsubscribes and spam reports combined |
Click any metric to open an event-level drill-down modal.
Performance metrics
Section titled “Performance metrics”High-level audience and play volume for the selected campaign.
| Metric | What it means |
|---|---|
| Contacts (or Accounts when breaking down by account) | Contacts or accounts targeted in this campaign |
| Generated | Presentations successfully created |
| Plays | Total presentation loads, with unique plays shown underneath |
Performance funnel
Section titled “Performance funnel”A conversion-style view of how contacts or accounts move through the campaign. All funnel steps use unique entity counts (each contact or account counted once per step).
| Step | What it means |
|---|---|
| Targeted | Contacts or accounts in scope for this campaign |
| Generated | Presentations created for those contacts |
| Emails Delivered | Unique contacts/accounts who received a delivered email |
| Emails Opened | Unique contacts/accounts who opened the email |
| Presentations Played | Unique contacts/accounts who played the presentation |
Click any funnel step to see the matching contact or account list.
Calls to action
Section titled “Calls to action”Six engagement cards, each with total count, unique count, and a small timeline chart showing activity over time.
| Card | What it tracks |
|---|---|
| Plays | Presentation views |
| Immersive Plays | Views in immersive/interactive mode |
| Recommendations | Clicks on recommendation links in the presentation |
| Feedback | Feedback form submissions (ratings, NPS-style responses, etc.) |
| Ask Me Anything | AMA chat interactions |
| Generative Forms | Generative form submissions |
Journey navigation
Section titled “Journey navigation”Paths contacts chose on navigation slides in your presentation. Expand a row to see all paths ranked by click count. Useful for understanding which branches contacts take through branching content.
Popular slides & recommendations
Section titled “Popular slides & recommendations”- Popular slides — slides ranked by total views in this campaign
- Top recommendations — recommendation links ranked by click count
Device, orientation & language
Section titled “Device, orientation & language”- Mobile vs Desktop — how contacts viewed the presentation
- Landscape vs Portrait — screen orientation breakdown
- Languages — which presentation languages were used
Details grid
Section titled “Details grid”Switch to Details in the Viewing menu for a paginated table with one row per contact or account.
Column groups (show/hide via the Columns control):
| Group | Columns |
|---|---|
| Email Delivery | Sent, Delivered, Not Delivered, Failed, Dropped, Bounce |
| Email Engagement | Open, Click, Unsubscribe, Spam |
| Presentation | Plays, Immersive Plays, Recommendations, Feedback, Form Submits, AMA |
Use Count Type (Total / Unique) in the Viewing menu to switch how the grid counts events. A summary row at the bottom shows column totals.
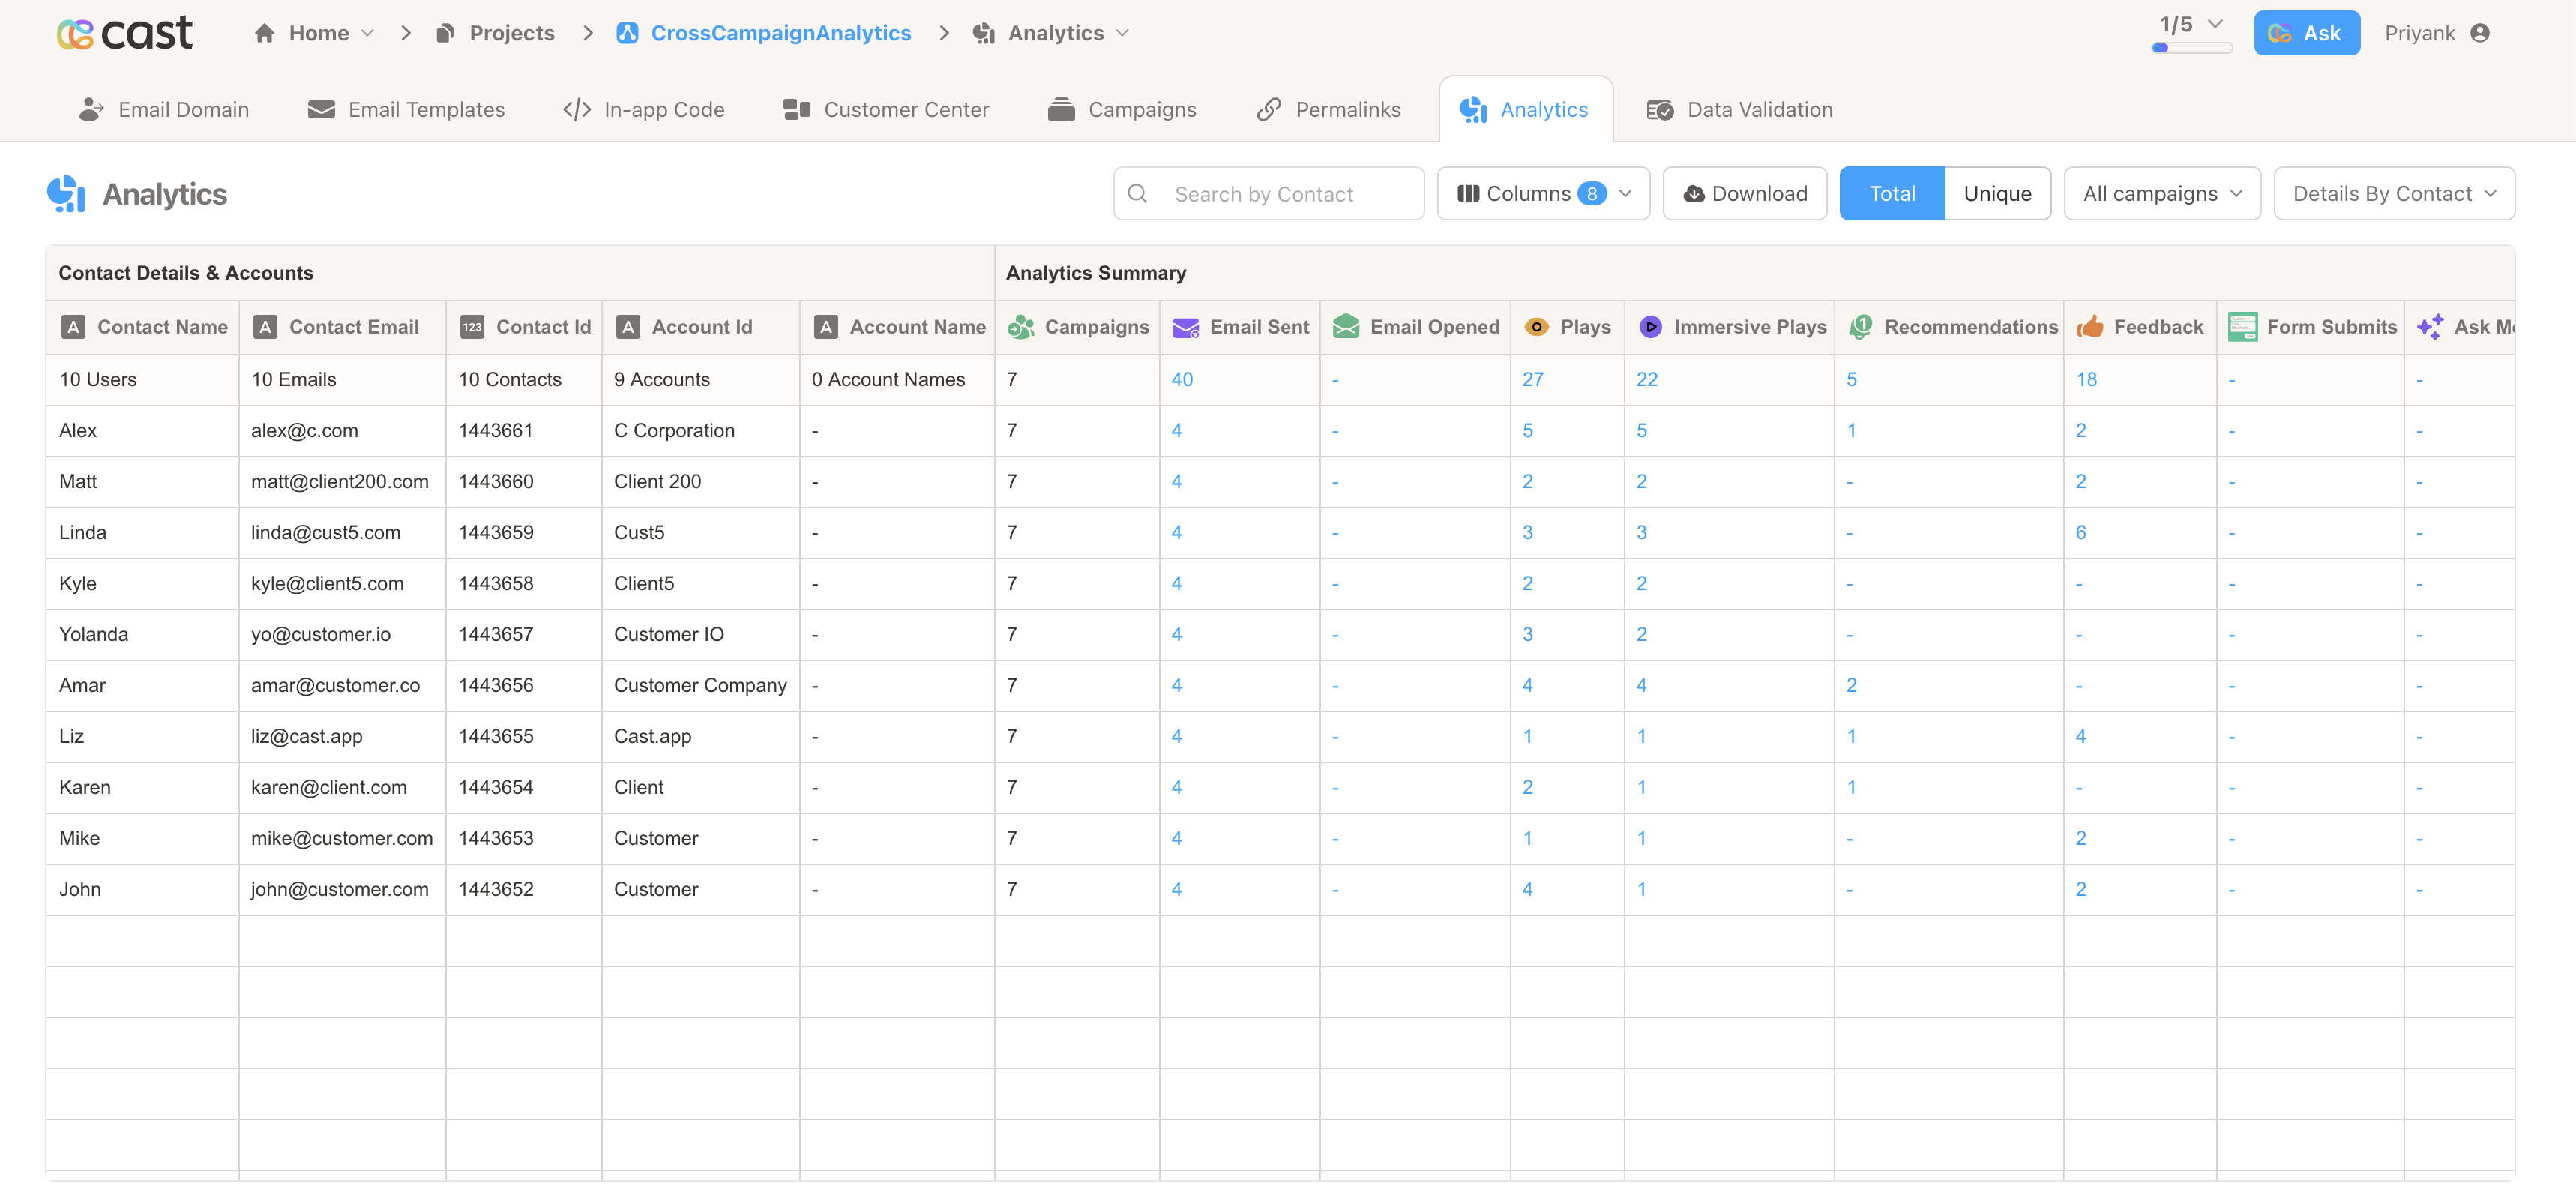
Click any cell to open the Event Details modal with timestamps, device info, and campaign context for that contact or account.
Viewing menu
Section titled “Viewing menu”| Setting | Options | Notes |
|---|---|---|
| View | Overview / Details | Which layout you see |
| Break Down By | By Contact / By Account | Changes row grouping and search fields |
| Count Type | Total / Unique | Details only — disabled on Overview |
By Contact — search by contact name, email, contact ID, account ID, or account name.
By Account — search by account ID or account name only; metrics aggregate across all contacts in each account.
Event detail modals
Section titled “Event detail modals”Click metrics on the campaign card, the Overview dashboard, or the Details grid to open drill-down modals:
- From campaign card delivery metrics — email events for that delivery status in this campaign
- From Overview — all matching events for the current filters
- From Details — full event history for one contact or account
Modals are sortable and paginated. Export raw events from some modals.
Data export
Section titled “Data export”Use Download in the filter bar:
| View | Export |
|---|---|
| Overview | Multi-worksheet Excel (summary, funnel, top slides, top actions, platform, language, email events, and more) |
| Details | Excel spreadsheet of the contact/account grid (respects Count Type) |
- Use campaign card badges for a quick generation and delivery snapshot while a campaign is running.
- Use the Analytics tab for engagement depth — plays, funnel, recommendations, journey paths, and per-contact follow-up.
- Add more campaigns in the filter bar to compare without leaving the page.
- Bookmark the URL after opening from a campaign tab to share that campaign’s filtered view.