
lc_funnel_or_hannoi
Funnel and Hannoi Visualization with lc_funnel_or_hannoi_*
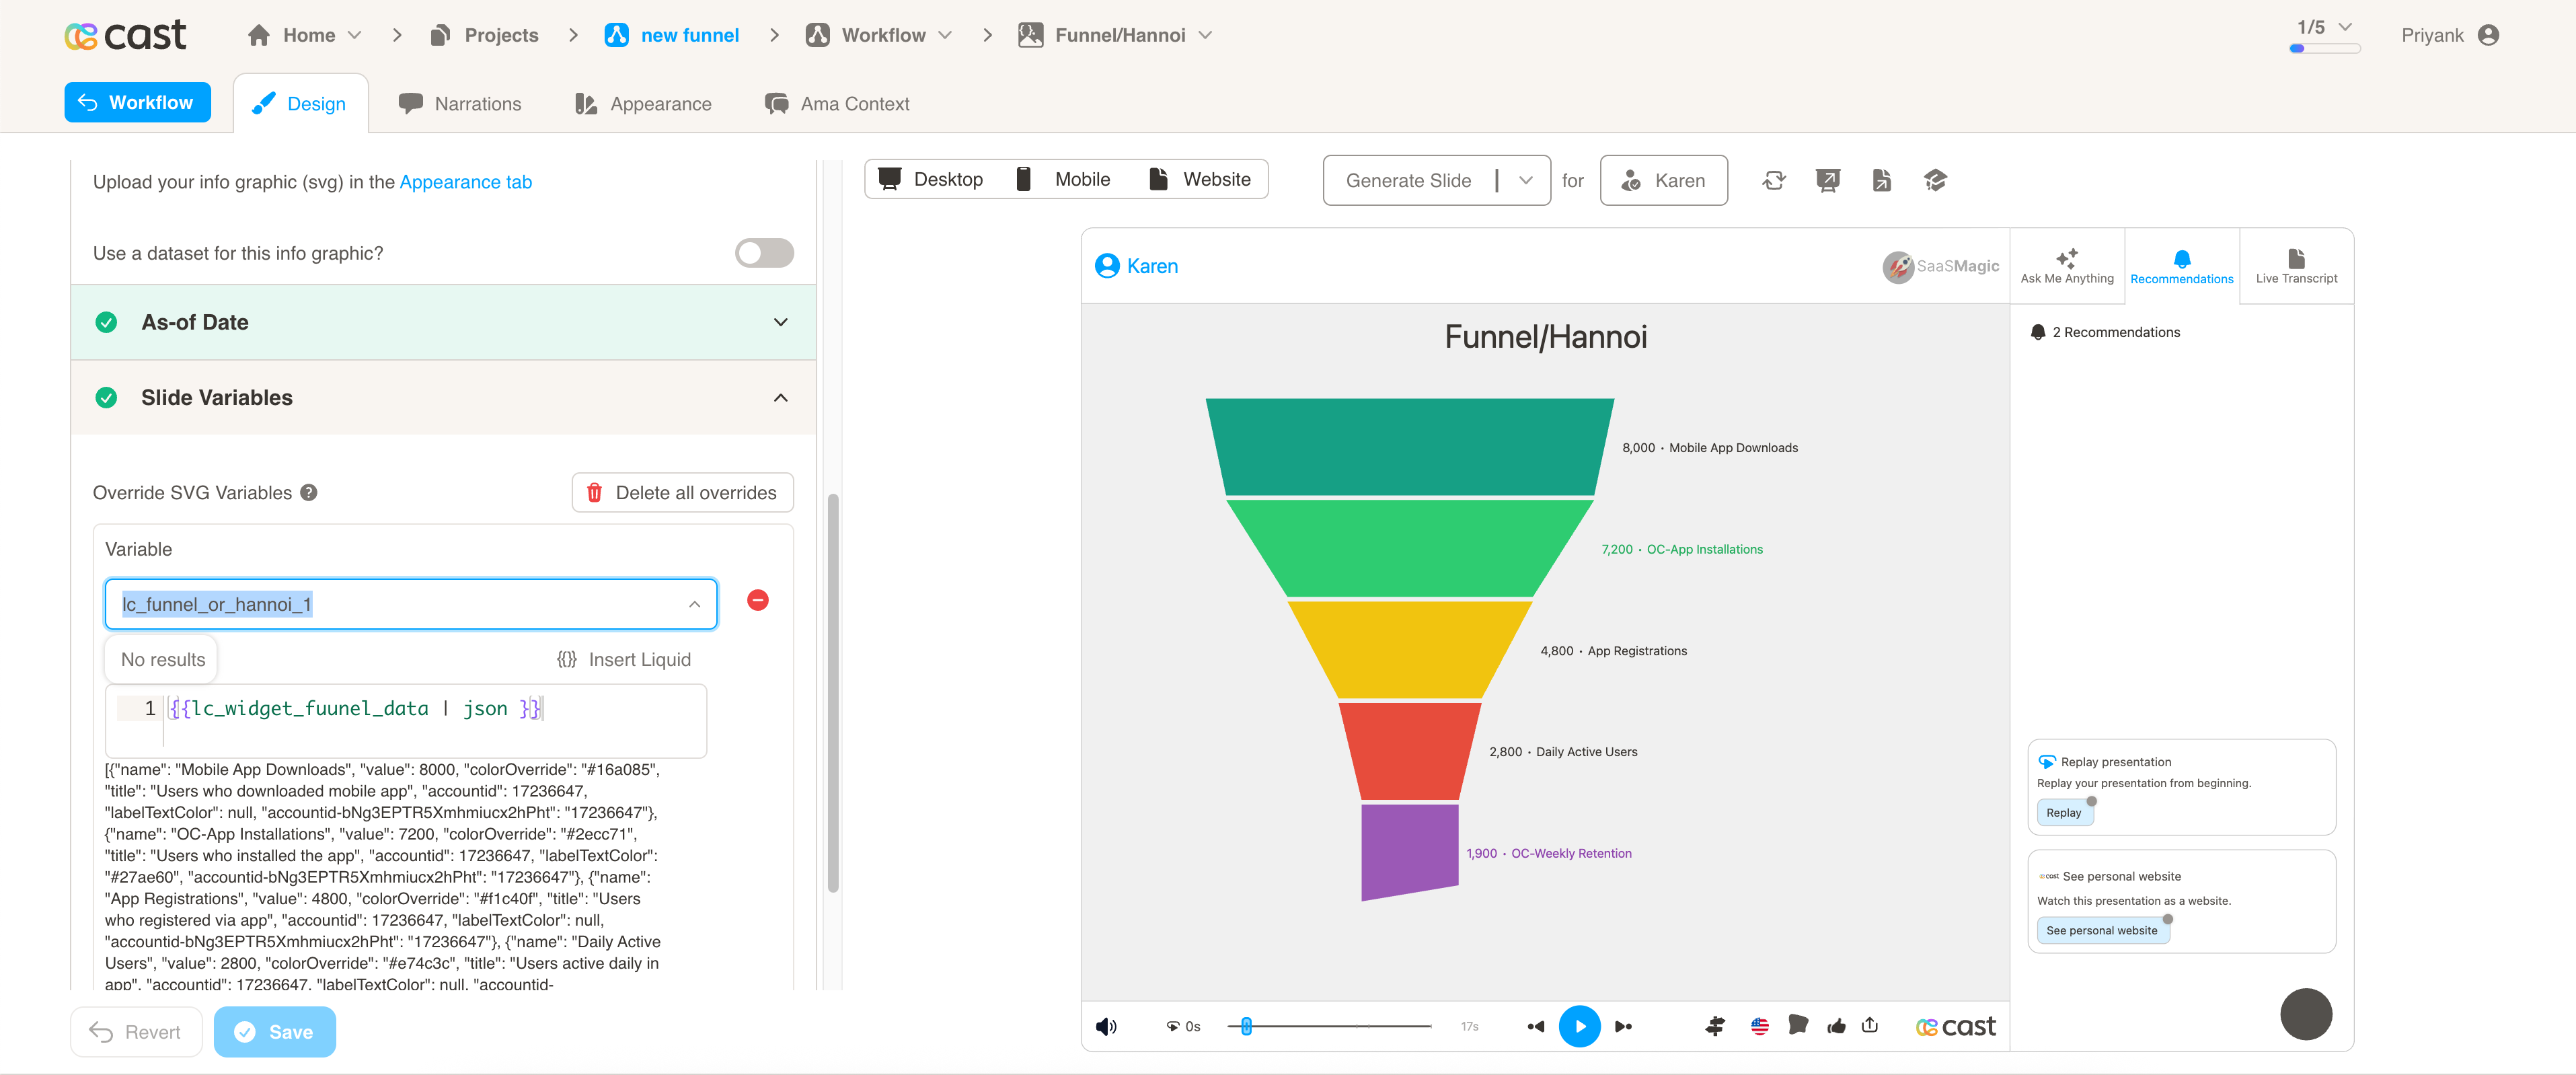
Section titled “Funnel and Hannoi Visualization with lc_funnel_or_hannoi_*”The lc_funnel_or_hannoi_* prefix renders funnel or hannoi charts automatically from your data — conversion funnels, sales processes, and category comparisons.
When to use it
- Conversion funnels and sales pipeline drop-off
- User journey and marketing campaign analysis
- Department or category comparisons (non-sequential data)
Quick reference
Section titled “Quick reference”| ID prefix | lc_funnel_or_hannoi_* |
| SVG element | <rect> only |
| Override value | JSON array of { name, value, colorOverride?, labelTextColor? } |
| Chart type | Descending values → funnel; mixed order → hannoi (auto-detected) |
Minimal example:
[ { "name": "Leads", "value": 10000, "colorOverride": "#3498db" }, { "name": "Qualified", "value": 7500, "colorOverride": "#2ecc71" }]Setup in Cast
Section titled “Setup in Cast”- Add a
<rect>whose ID starts withlc_funnel_or_hannoi_. - Create a dataset field with columns
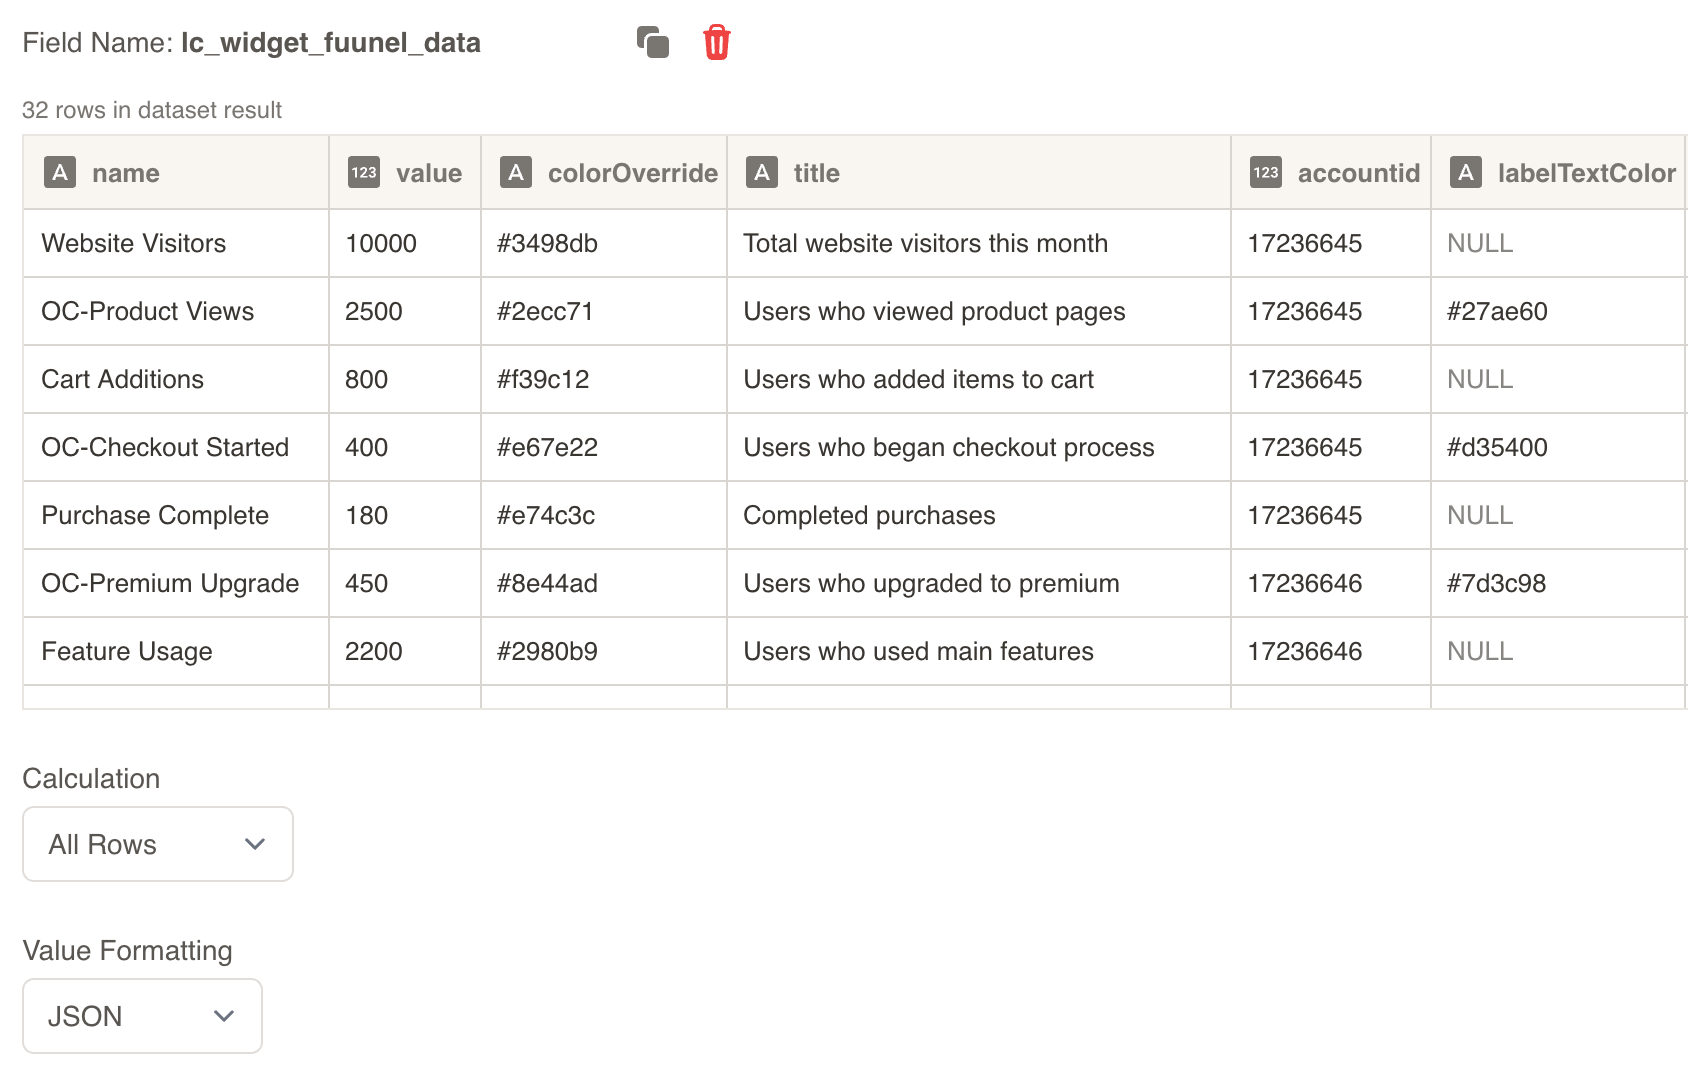
name,value(and optional color columns); set Value Formatting → JSON. - In Override SVG Variables, reference the field with
{% raw %}{{ my_field | json }}{% endraw %}.
Samples
Section titled “Samples”
Advanced: chart types, JSON reference, highlighting, and examples
Automatic Chart Type Detection
- Funnel Chart: Values in descending order → Trapezoid shapes that narrow from top to bottom
- Hannoi Chart: Values in mixed order → Uniform rounded rectangles with varying widths
Use Cases
Funnel Charts (Descending Values):
- Conversion funnels and sales processes
- User journey analysis and drop-off tracking
- Marketing campaign effectiveness
- Lead qualification and pipeline analysis
- Customer acquisition funnels
- Website conversion optimization
Hannoi Charts (Mixed Values):
- Department performance comparisons
- Category analysis and benchmarking
- Product or service comparisons
- Regional performance analysis
- Resource allocation visualization
- Non-sequential data comparison
Element Identification
The target element must be a <rect> with an ID that starts with lc_funnel_or_hannoi_* for automatic funnel or hannoi chart visualization.
Input Format
The input value must be provided as a JSON array of objects with the following structure:
JSON Format
Section titled “JSON Format”A JSON string containing an array of objects with the following structure:
[ { "name": "Website Visitors", "value": 125000, "colorOverride": "#3498db", "labelTextColor": "#2c3e50" }, { "name": "Product Demo Requests", "value": 45000, "colorOverride": "#2ecc71", "labelTextColor": "#2c3e50" }, { "name": "Trial Signups", "value": 18500, "colorOverride": "#f39c12" }, { "name": "Paid Customers", "value": 5200, "colorOverride": "#9b59b6" }]Dataset/CSV Format
Section titled “Dataset/CSV Format”Alternatively, you can use tabular data from your datasets with the following columns:
| name | value | colorOverride | labelTextColor |
|---|---|---|---|
| Website Visitors | 125000 | #3498db | #2c3e50 |
| Product Demo Requests | 45000 | #2ecc71 | #2c3e50 |
| Trial Signups | 18500 | #f39c12 | #2c3e50 |
| Paid Customers | 5200 | #9b59b6 | #2c3e50 |
| Enterprise Customers | 850 | #e74c3c | #ffffff |
Download Sample Data - Funnel or Hannoi
Dataset Usage:
- Connect your funnel/hannoi chart to a dataset containing the required columns
- The system will automatically map the columns to the appropriate chart properties
- Filter data by categories or time ranges to show relevant comparisons
- Multiple rows create comprehensive funnel or hannoi visualizations
Important Notes:
- Column names must match exactly as shown in the example (
name,value,colorOverride,labelTextColor) - Column names are case-sensitive and must be spelled exactly as specified
- If data is not passed in the correct format or column names don’t match, the element will display as a plain
<rect>without any chart visualization - The
namefield supports auto-truncation at 22 characters for long names
Implementation Steps for Dataset Usage
Section titled “Implementation Steps for Dataset Usage”To use dataset/CSV format with funnel/hannoi charts, follow these steps:
Create Dataset: Import your data containing the required columns (name, value, colorOverride, labelTextColor)
Create Field: Create a field from your dataset that contains the funnel/hannoi chart data
Set Value Formatting: In the field settings, set Value Formatting to “JSON” - this is crucial for proper data formatting
Override SVG Variables: In the SVG slide design tab, go to “Override SVG Variables”
Select Variable: Choose your funnel/hannoi chart variable and use the format with your field
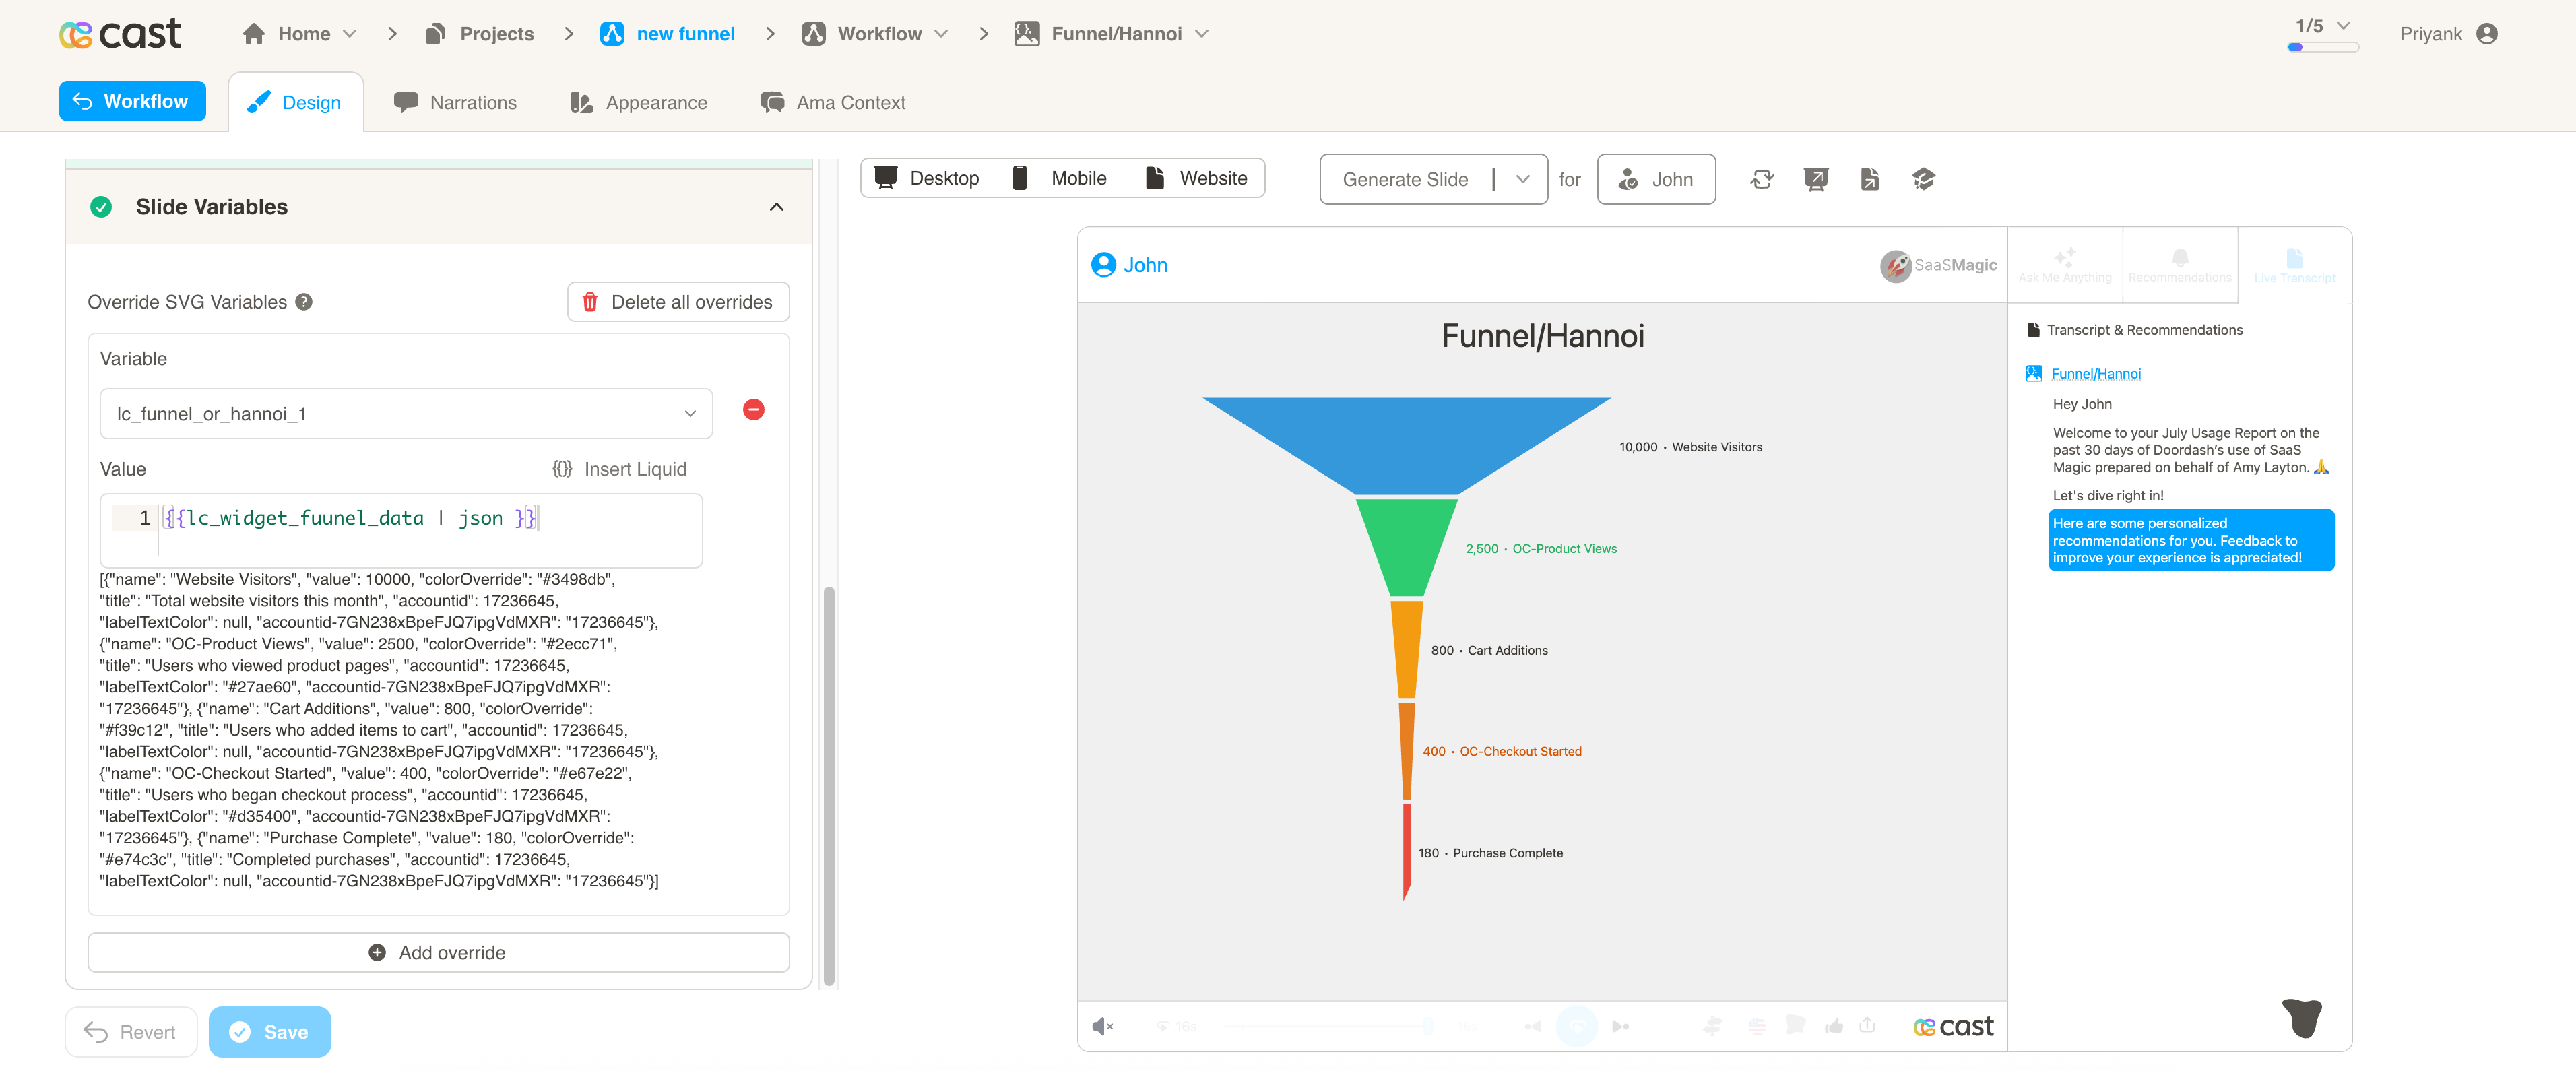
Include JSON Filter: Critical: Always include the | json filter with your field, otherwise the funnel/hannoi chart will not work
Configuration Properties
Required Properties:
name: Display name for the segment (mandatory, auto-truncated at 22 characters)value: Numeric value for the segment (mandatory, negative values converted to 0)
Optional Properties:
colorOverride: Custom hex color code or color name for segment fill (optional)labelTextColor: Custom hex color code or color name for label text (optional)
Color Specifications
Color Override:
- Provide hex color codes:
"#D32F2F","#F57C00" - Use CSS color names:
"red","blue","green" - Each segment can have its own individual color specification
Label Text Color:
- Provide hex color codes:
"#595551","#333333" - Use CSS color names for consistent text styling
- Controls the color of value labels and segment names
Color Behavior:
- If no colors are provided, colors will be auto-assigned from the appearance settings and project color palette
- Individual segments can override default colors for visual emphasis
- Colors ensure visual distinction between different segments
Compatibility: Works with <rect> elements only
Example Usage
Section titled “Example Usage”Example 1: Sales Funnel (Descending Values → Funnel Chart)
Section titled “Example 1: Sales Funnel (Descending Values → Funnel Chart)”JSON Data:
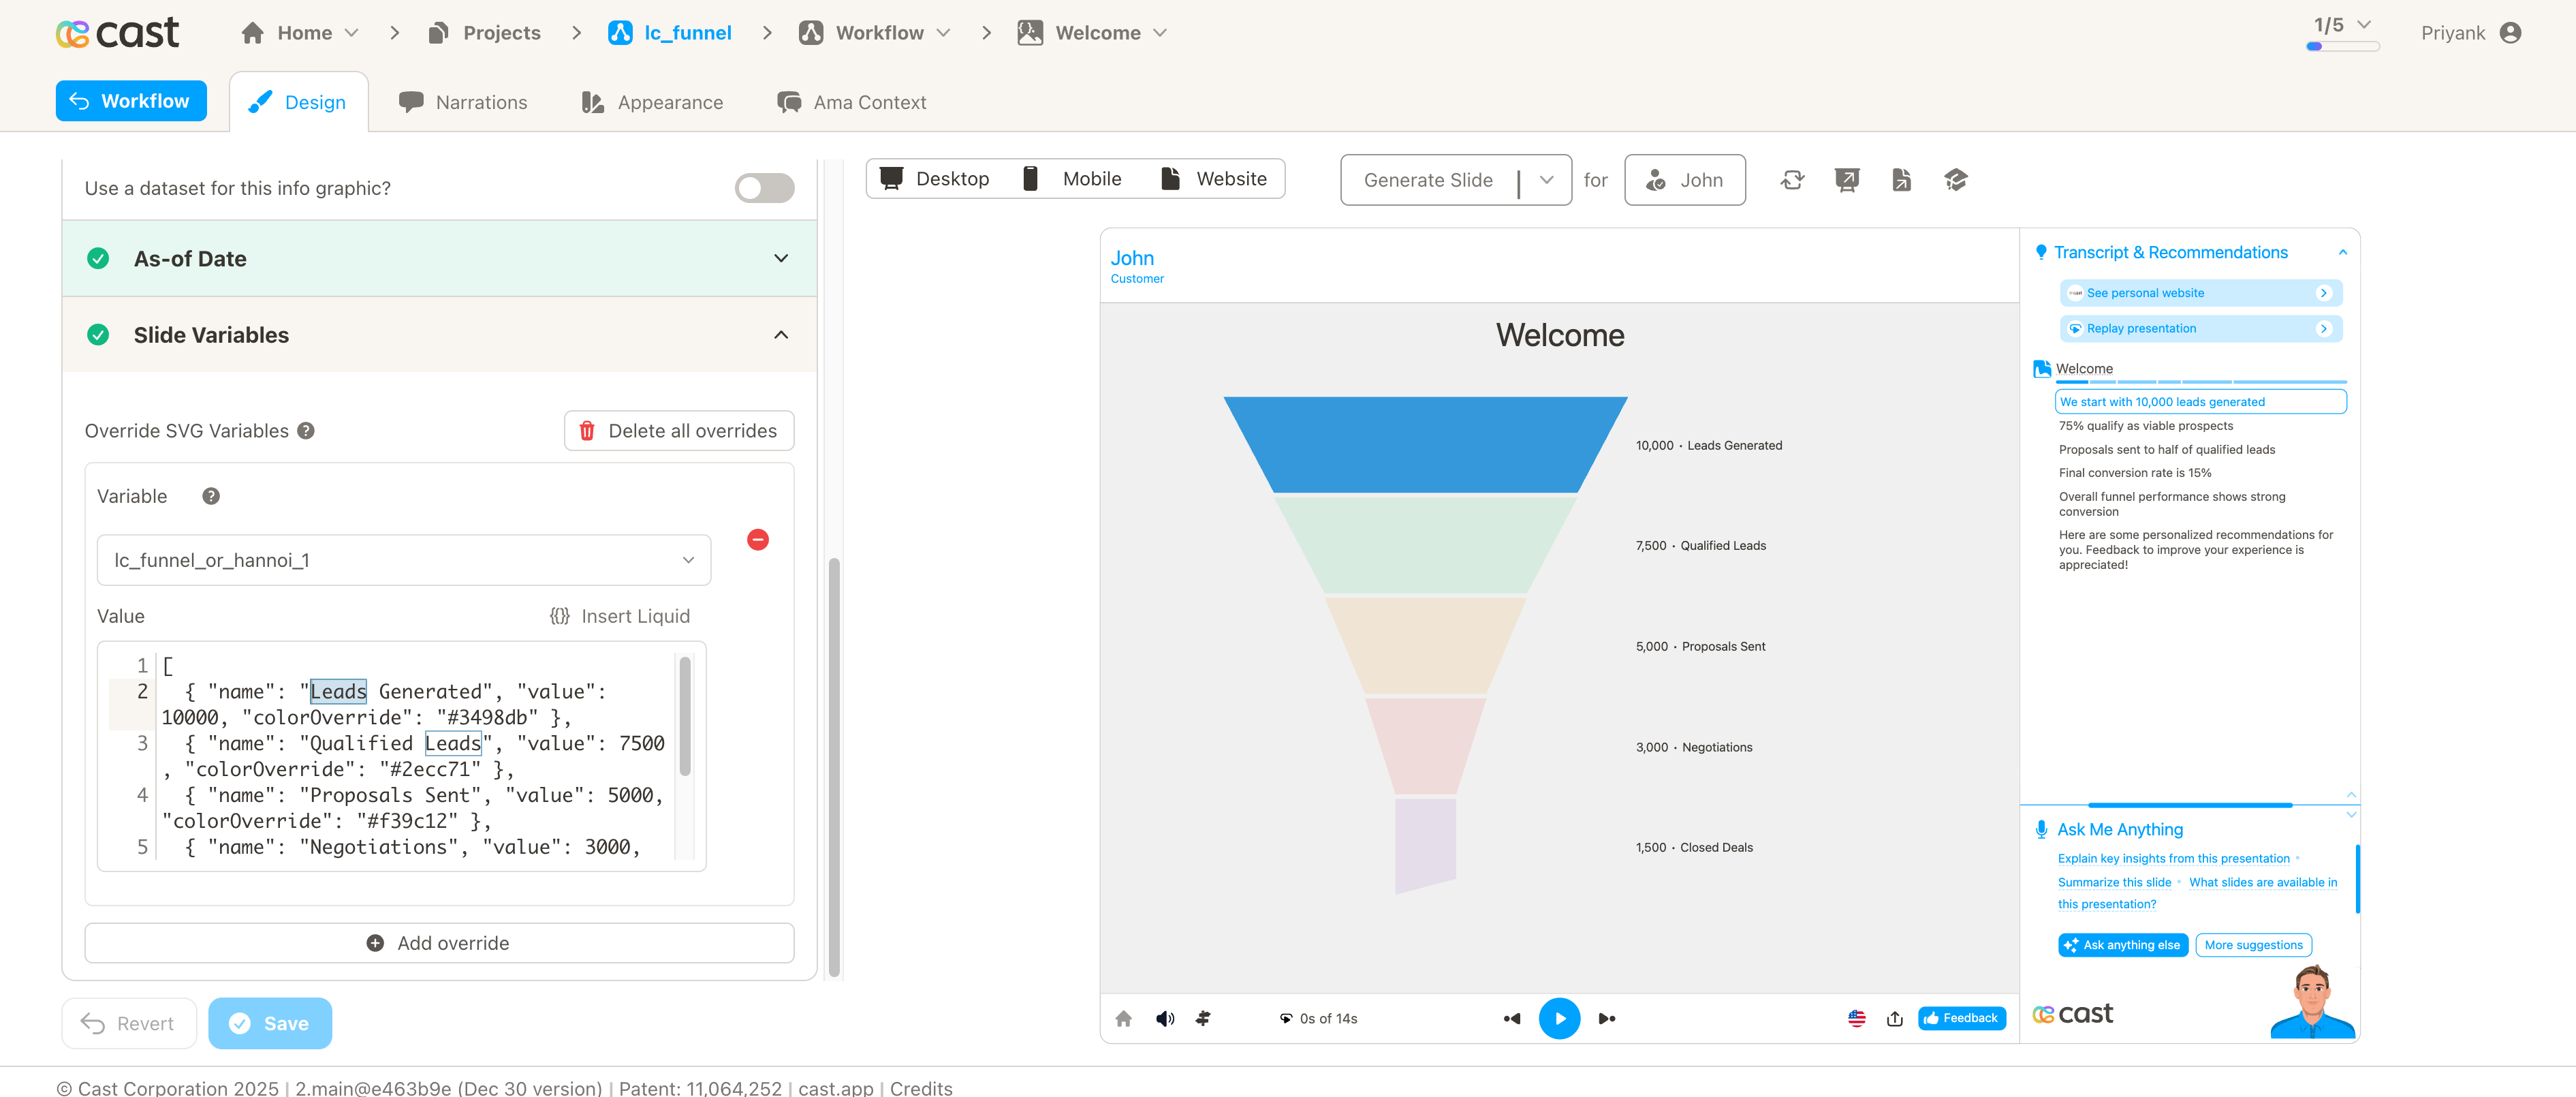
[ { "name": "Leads Generated", "value": 10000, "colorOverride": "#3498db" }, { "name": "Qualified Leads", "value": 7500, "colorOverride": "#2ecc71" }, { "name": "Proposals Sent", "value": 5000, "colorOverride": "#f39c12" }, { "name": "Negotiations", "value": 3000, "colorOverride": "#e74c3c" }, { "name": "Closed Deals", "value": 1500, "colorOverride": "#9b59b6" }]Example 2: Quarterly Budget by Department (Mixed Values → Hannoi Chart)
Section titled “Example 2: Quarterly Budget by Department (Mixed Values → Hannoi Chart)”JSON Data:
[ { "name": "Engineering", "value": 2850000, "colorOverride": "#3498db", "labelTextColor": "#ffffff" }, { "name": "Sales & Marketing", "value": 1950000, "colorOverride": "#2ecc71", "labelTextColor": "#ffffff" }, { "name": "Customer Success", "value": 875000, "colorOverride": "#f39c12", "labelTextColor": "#2c3e50" }, { "name": "Operations", "value": 1450000, "colorOverride": "#9b59b6", "labelTextColor": "#ffffff" }, { "name": "Product Design", "value": 680000, "colorOverride": "#e74c3c", "labelTextColor": "#ffffff" }]Example 3: Customer Journey (Long Names with Truncation)
Section titled “Example 3: Customer Journey (Long Names with Truncation)”JSON Data:
[ { "name": "Initial Brand Awareness and Discovery", "value": 50000 }, { "name": "Active Research and Consideration", "value": 35000 }, { "name": "Evaluation and Comparison Shopping", "value": 25000 }, { "name": "Purchase Decision and Transaction", "value": 15000 }, { "name": "Post-Purchase Experience and Support", "value": 12000 }, { "name": "Loyalty and Repeat Purchase Behavior", "value": 8000 }]Example 4: Website Analytics (Custom Colors)
Section titled “Example 4: Website Analytics (Custom Colors)”JSON Data:
[ { "name": "Page Views", "value": 125000, "colorOverride": "#FF6B6B", "labelTextColor": "#2C3E50" }, { "name": "Unique Visitors", "value": 95000, "colorOverride": "#4ECDC4", "labelTextColor": "#2C3E50" }, { "name": "Engaged Sessions", "value": 67000, "colorOverride": "#45B7D1", "labelTextColor": "#2C3E50" }, { "name": "Goal Completions", "value": 23000, "colorOverride": "#96CEB4", "labelTextColor": "#2C3E50" }, { "name": "Conversions", "value": 8500, "colorOverride": "#FFEAA7", "labelTextColor": "#2C3E50" }]Highlighting Individual Segments
Section titled “Highlighting Individual Segments”Funnel and Hannoi charts support selective highlighting during your presentation, allowing you to draw attention to specific segments while others fade into the background.
How It Works:
When you reference a segment’s name in your narration, that segment automatically highlights (full brightness) while other segments dim to about 12% brightness. Labels remain fully visible so your audience can always read them.
Setting Up Highlights:
To enable highlighting, your funnel/hannoi data must include the name property. The system matches these names with your highlight configuration to determine which segments to highlight.
Important Note: Your data uses the name field, but highlights use the label key to match. For example:
- Data:
{"name":"Qualified Leads","value":7500} - Highlight:
[{"label":"Qualified Leads"}]
How to Add Highlights in Cast Designer:
- Open your project in Cast designer
- Navigate to Narration tab
- Click on Visual Explanations for the slide with your funnel/hannoi chart
- Find the liquid block for your
lc_funnel_or_hannoielement - Add the highlight format directly in the liquid block
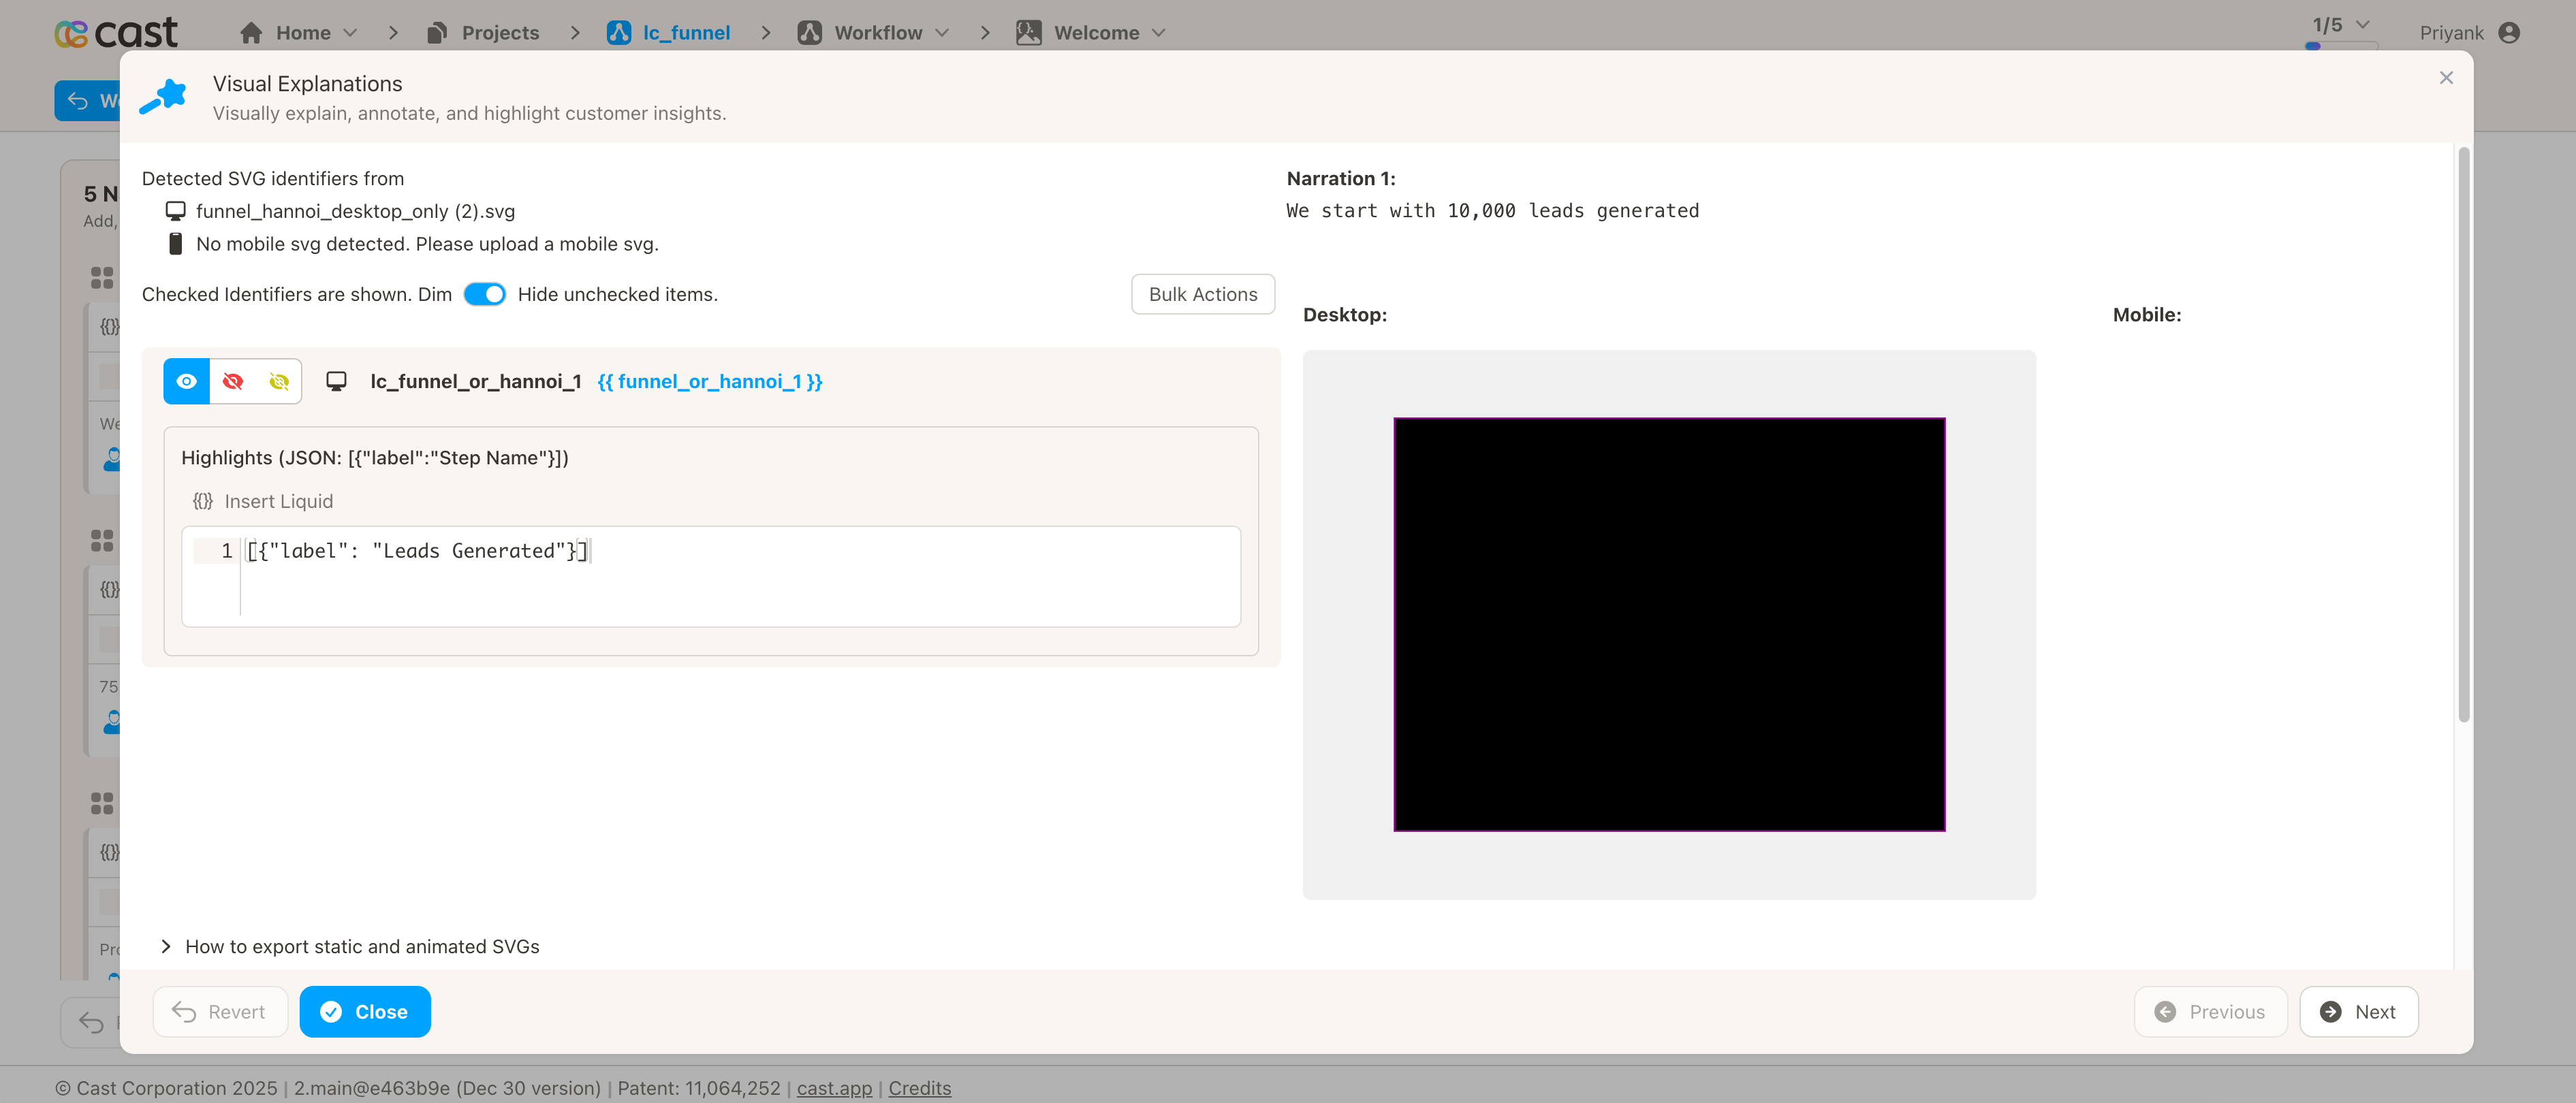
Preview Result:
Highlight Format:
Single segment:
[{ "label": "Qualified Leads" }]Multiple segments:
[{ "label": "Qualified Leads" }, { "label": "Closed Deals" }]All segments visible (no dimming):
(Don't add any highlight to the liquid block)Example 1: Sales Funnel Analysis
Section titled “Example 1: Sales Funnel Analysis”Your Funnel Data:
[ { "name": "Leads Generated", "value": 10000, "colorOverride": "#3498db" }, { "name": "Qualified Leads", "value": 7500, "colorOverride": "#2ecc71" }, { "name": "Proposals Sent", "value": 5000, "colorOverride": "#f39c12" }, { "name": "Negotiations", "value": 3000, "colorOverride": "#e74c3c" }, { "name": "Closed Deals", "value": 1500, "colorOverride": "#9b59b6" }]Narration Steps:
-
Narration Step 1: “We start with 10,000 leads generated…”
- Add to liquid block:
[{"label": "Leads Generated"}] - Result: Leads Generated segment stays bright, all others dim
- Add to liquid block:
-
Narration Step 2: “75% qualify as viable prospects…”
- Add to liquid block:
[{"label": "Qualified Leads"}] - Result: Qualified Leads segment brightens, others dim
- Add to liquid block:
-
Narration Step 3: “Proposals sent to half of qualified leads…”
- Add to liquid block:
[{"label": "Proposals Sent"}] - Result: Proposals Sent segment brightens, others dim
- Add to liquid block:
-
Narration Step 4: “Final conversion rate is 15%…”
- Add to liquid block:
[{"label": "Closed Deals"}] - Result: Closed Deals segment brightens, others dim
- Add to liquid block:
-
Narration Step 5: “Overall funnel performance shows strong conversion…”
- Add to liquid block: Don’t add any highlight
- Result: All segments appear at full brightness
Example 2: Department Budget Comparison (Hannoi Chart)
Section titled “Example 2: Department Budget Comparison (Hannoi Chart)”Your Hannoi Data:
[ { "name": "Engineering", "value": 2850000, "colorOverride": "#3498db", "labelTextColor": "#ffffff" }, { "name": "Sales & Marketing", "value": 1950000, "colorOverride": "#2ecc71", "labelTextColor": "#ffffff" }, { "name": "Customer Success", "value": 875000, "colorOverride": "#f39c12", "labelTextColor": "#2c3e50" }, { "name": "Operations", "value": 1450000, "colorOverride": "#9b59b6", "labelTextColor": "#ffffff" }, { "name": "Product Design", "value": 680000, "colorOverride": "#e74c3c", "labelTextColor": "#ffffff" }]Liquid Block Highlights:
-
All Departments Overview: Show all segments together (no specific highlight)
- Liquid block: Don’t add any highlight
- Result: All segments appear at full brightness
-
Focus on Engineering: “Engineering receives the largest allocation…”
- Liquid block:
[{"label": "Engineering"}] - Result: Engineering segment brightens, others dim
- Liquid block:
-
Sales and Marketing Investment: “Sales & Marketing accounts for significant spending…”
- Liquid block:
[{"label": "Sales & Marketing"}] - Result: Sales & Marketing segment brightens, others dim
- Liquid block:
-
Compare Top Spenders: “Engineering and Sales & Marketing together…”
- Liquid block:
[{"label": "Engineering"}, {"label": "Sales & Marketing"}] - Result: Both Engineering and Sales & Marketing segments bright, others dim
- Liquid block:
Example 3: Customer Journey Funnel
Section titled “Example 3: Customer Journey Funnel”Your Funnel Data:
[ { "name": "Page Views", "value": 125000, "colorOverride": "#FF6B6B", "labelTextColor": "#2C3E50" }, { "name": "Unique Visitors", "value": 95000, "colorOverride": "#4ECDC4", "labelTextColor": "#2C3E50" }, { "name": "Engaged Sessions", "value": 67000, "colorOverride": "#45B7D1", "labelTextColor": "#2C3E50" }, { "name": "Goal Completions", "value": 23000, "colorOverride": "#96CEB4", "labelTextColor": "#2C3E50" }, { "name": "Conversions", "value": 8500, "colorOverride": "#FFEAA7", "labelTextColor": "#2C3E50" }]Liquid Block Highlights:
-
“We recorded 125,000 page views…”
- Liquid block:
[{"label": "Page Views"}] - Result: Page Views segment highlights
- Liquid block:
-
“Engagement rate is strong with 67,000 sessions…”
- Liquid block:
[{"label": "Engaged Sessions"}] - Result: Engaged Sessions segment highlights
- Liquid block:
-
“Final conversion rate stands at 6.8%…”
- Liquid block:
[{"label": "Conversions"}] - Result: Conversions segment highlights
- Liquid block:
-
“The complete journey from view to conversion…”
- Liquid block: Don’t add any highlight
- Result: All segments at full brightness