
Analytics
Analytics
Section titled “Analytics”The Analytics page shows how contacts and accounts engage across your campaigns. Use it to review program-level performance, drill into individual contacts, and export data for reporting.
How to get there
Section titled “How to get there”The Analytics page is part of Campaigns & Analytics. Open it from the Analytics option in the Workflow dropdown (previously called Contact Analytics).
Option A — Open Analytics for all campaigns
- Open your Cast project.
- Hover the Workflow breadcrumb in the project navigation bar and click Analytics in the dropdown (a direct menu option — same level as Campaigns and Permalinks).
- You land on the Overview view by default.
Option B — Open Analytics for one campaign
- Hover the Workflow breadcrumb and click Campaigns.
- Click the campaign you want to analyze.
- Click the Analytics tab on the campaign (next to Edit Email and Deliver).
You are taken to the same Analytics page as Option A, with that campaign automatically applied as a filter. The page URL updates to include the selected campaign so you can bookmark or share the filtered view.
Analytics views
Section titled “Analytics views”Use the Viewing menu at the top of the page to switch between two views. Both views share the same campaign filters, search, and Break Down By setting.
Overview (default)
Section titled “Overview (default)”A dashboard summary across your selected campaigns. Overview opens by default when you visit Analytics.
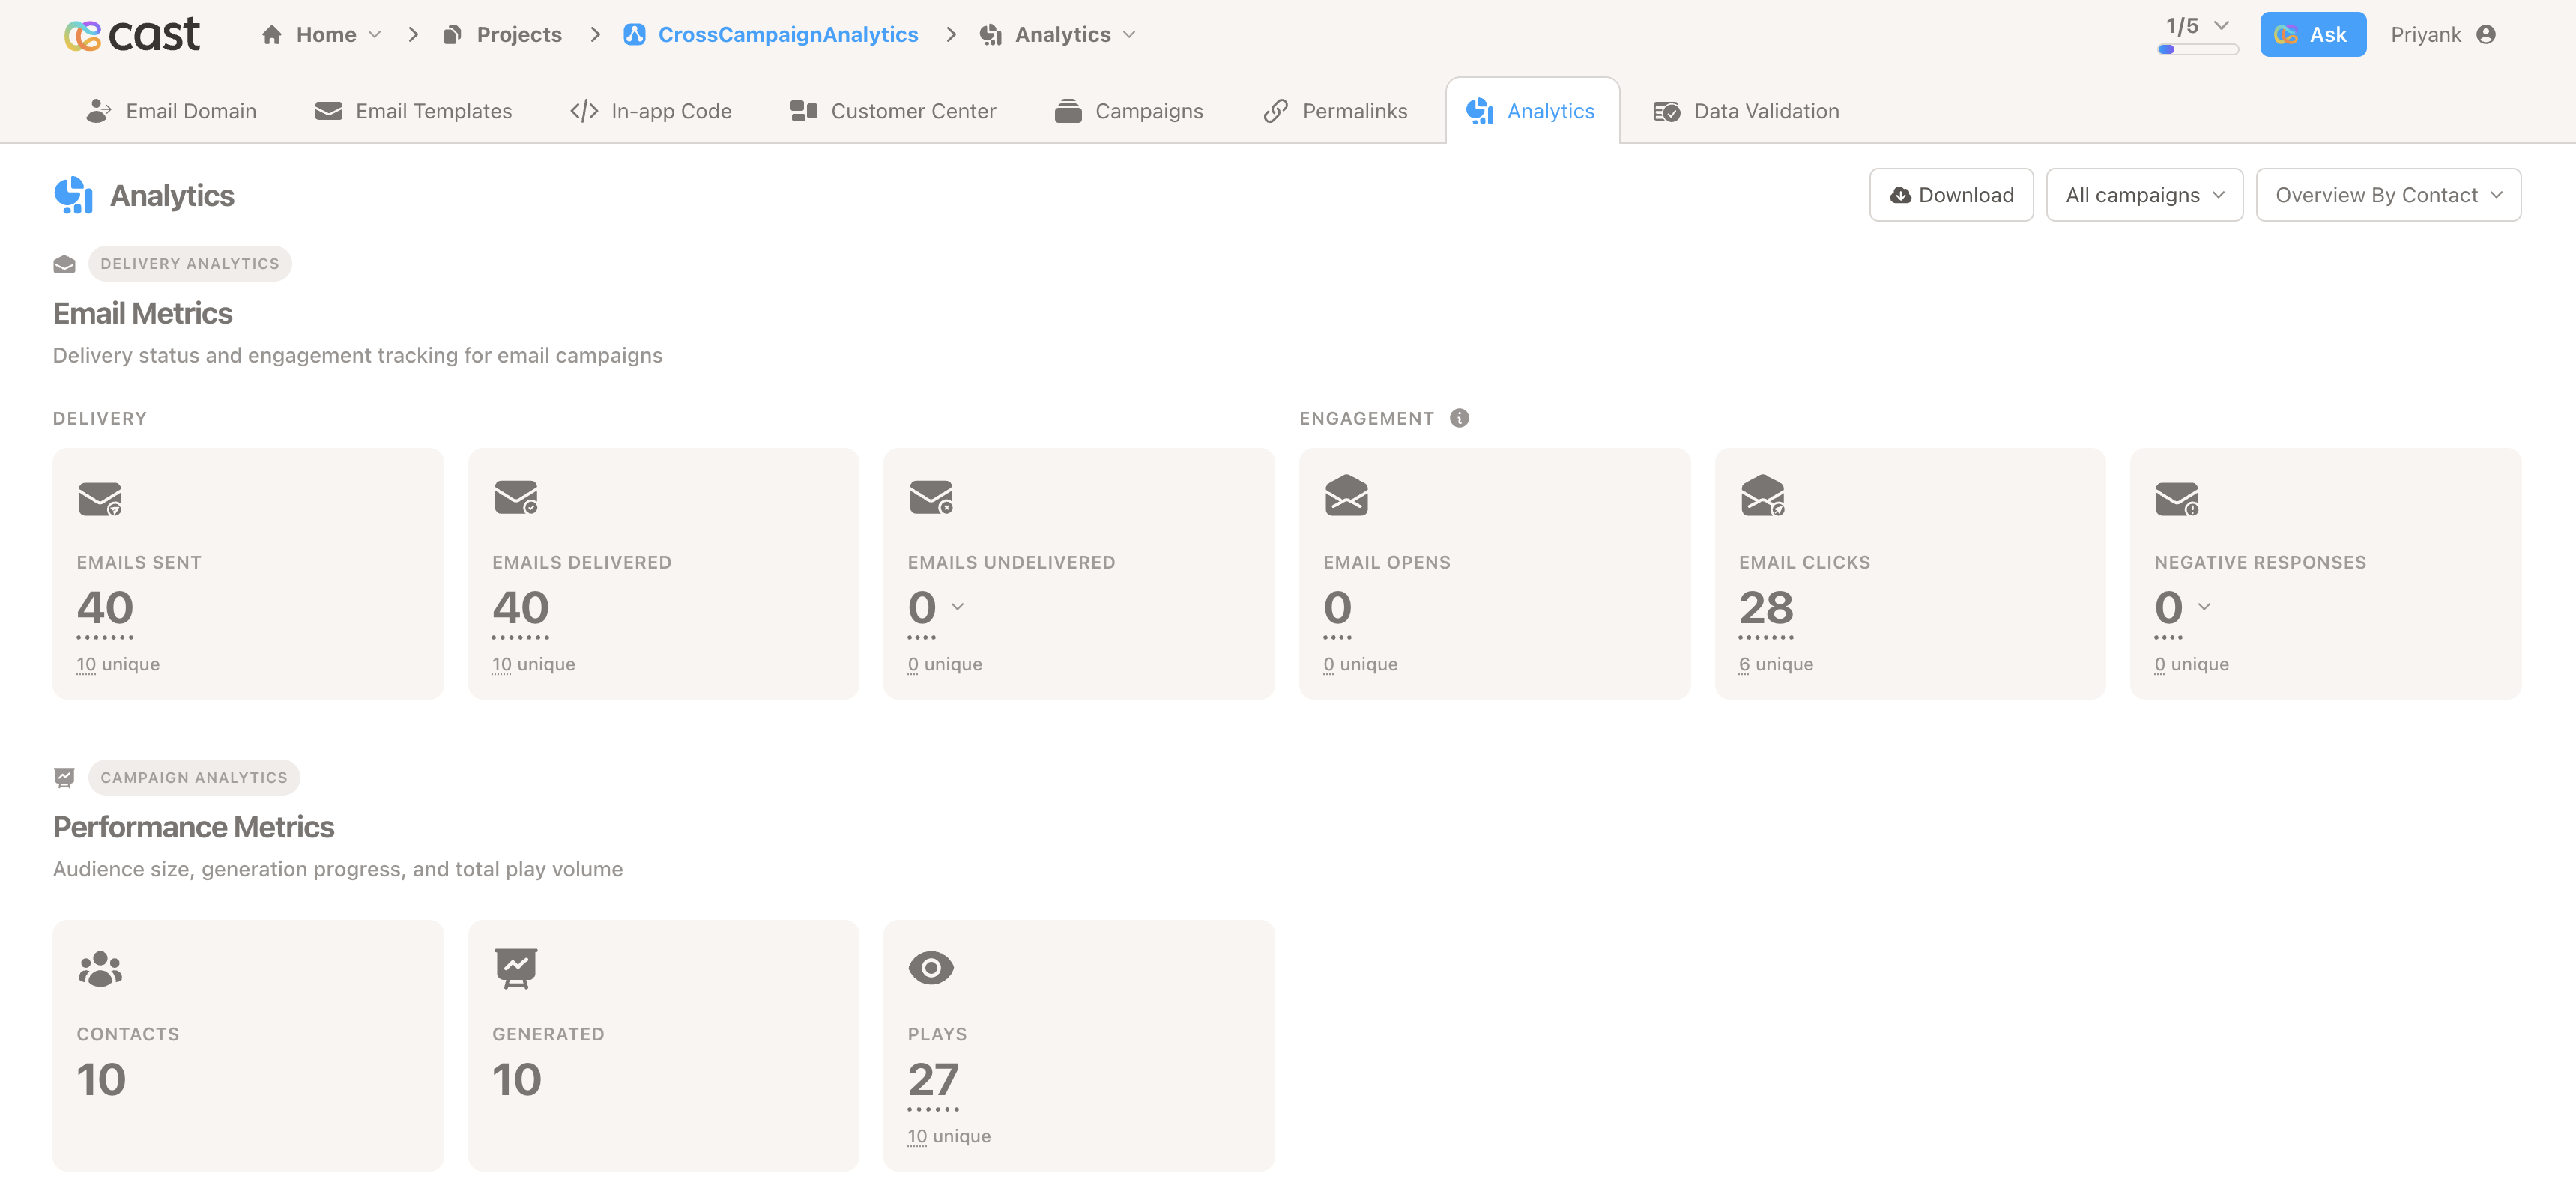
Sections on Overview:
| Section | What it shows |
|---|---|
| Email delivery | Sent, delivered, not delivered, opens, clicks, and negative responses (unsubscribes and spam reports). Most metrics show a total count and a smaller unique count underneath. |
| Performance metrics | High-level presentation stats (plays, contacts generated). |
| Performance funnel | Conversion-style stages: targeted → generated → emails delivered → emails opened → presentations played. Funnel counts are always unique per contact or account. |
| Calls to action | Six cards — Plays, Immersive Plays, Recommendations, Feedback, Ask Me Anything, and Generative Forms. Each card shows total and unique counts plus a small timeline chart. |
| Journey navigation | Paths contacts chose on navigation slides in your presentation (expand a row to see all paths ranked by clicks). |
| Popular slides & recommendations | Most-viewed slides and most-clicked recommendations. |
| Device, orientation & language | Mobile vs desktop usage and language distribution. |
Count Type on Overview: The Total / Unique toggle in the Viewing menu is visible but disabled on Overview. Overview always shows both total and unique counts inline where applicable.
Click totals, unique counts, funnel steps, or chart areas to open drill-down modals with event-level detail.
Details
Section titled “Details”A paginated grid with one row per contact or account (depending on Break Down By) and columns for each event type.
Details is best for:
- Comparing engagement across many contacts or accounts
- Showing or hiding specific metric columns
- Switching between Total and Unique counts for the whole grid
Use the Columns control (Details only) to show or hide metric groups: Email Delivery, Email Engagement, and Presentation.
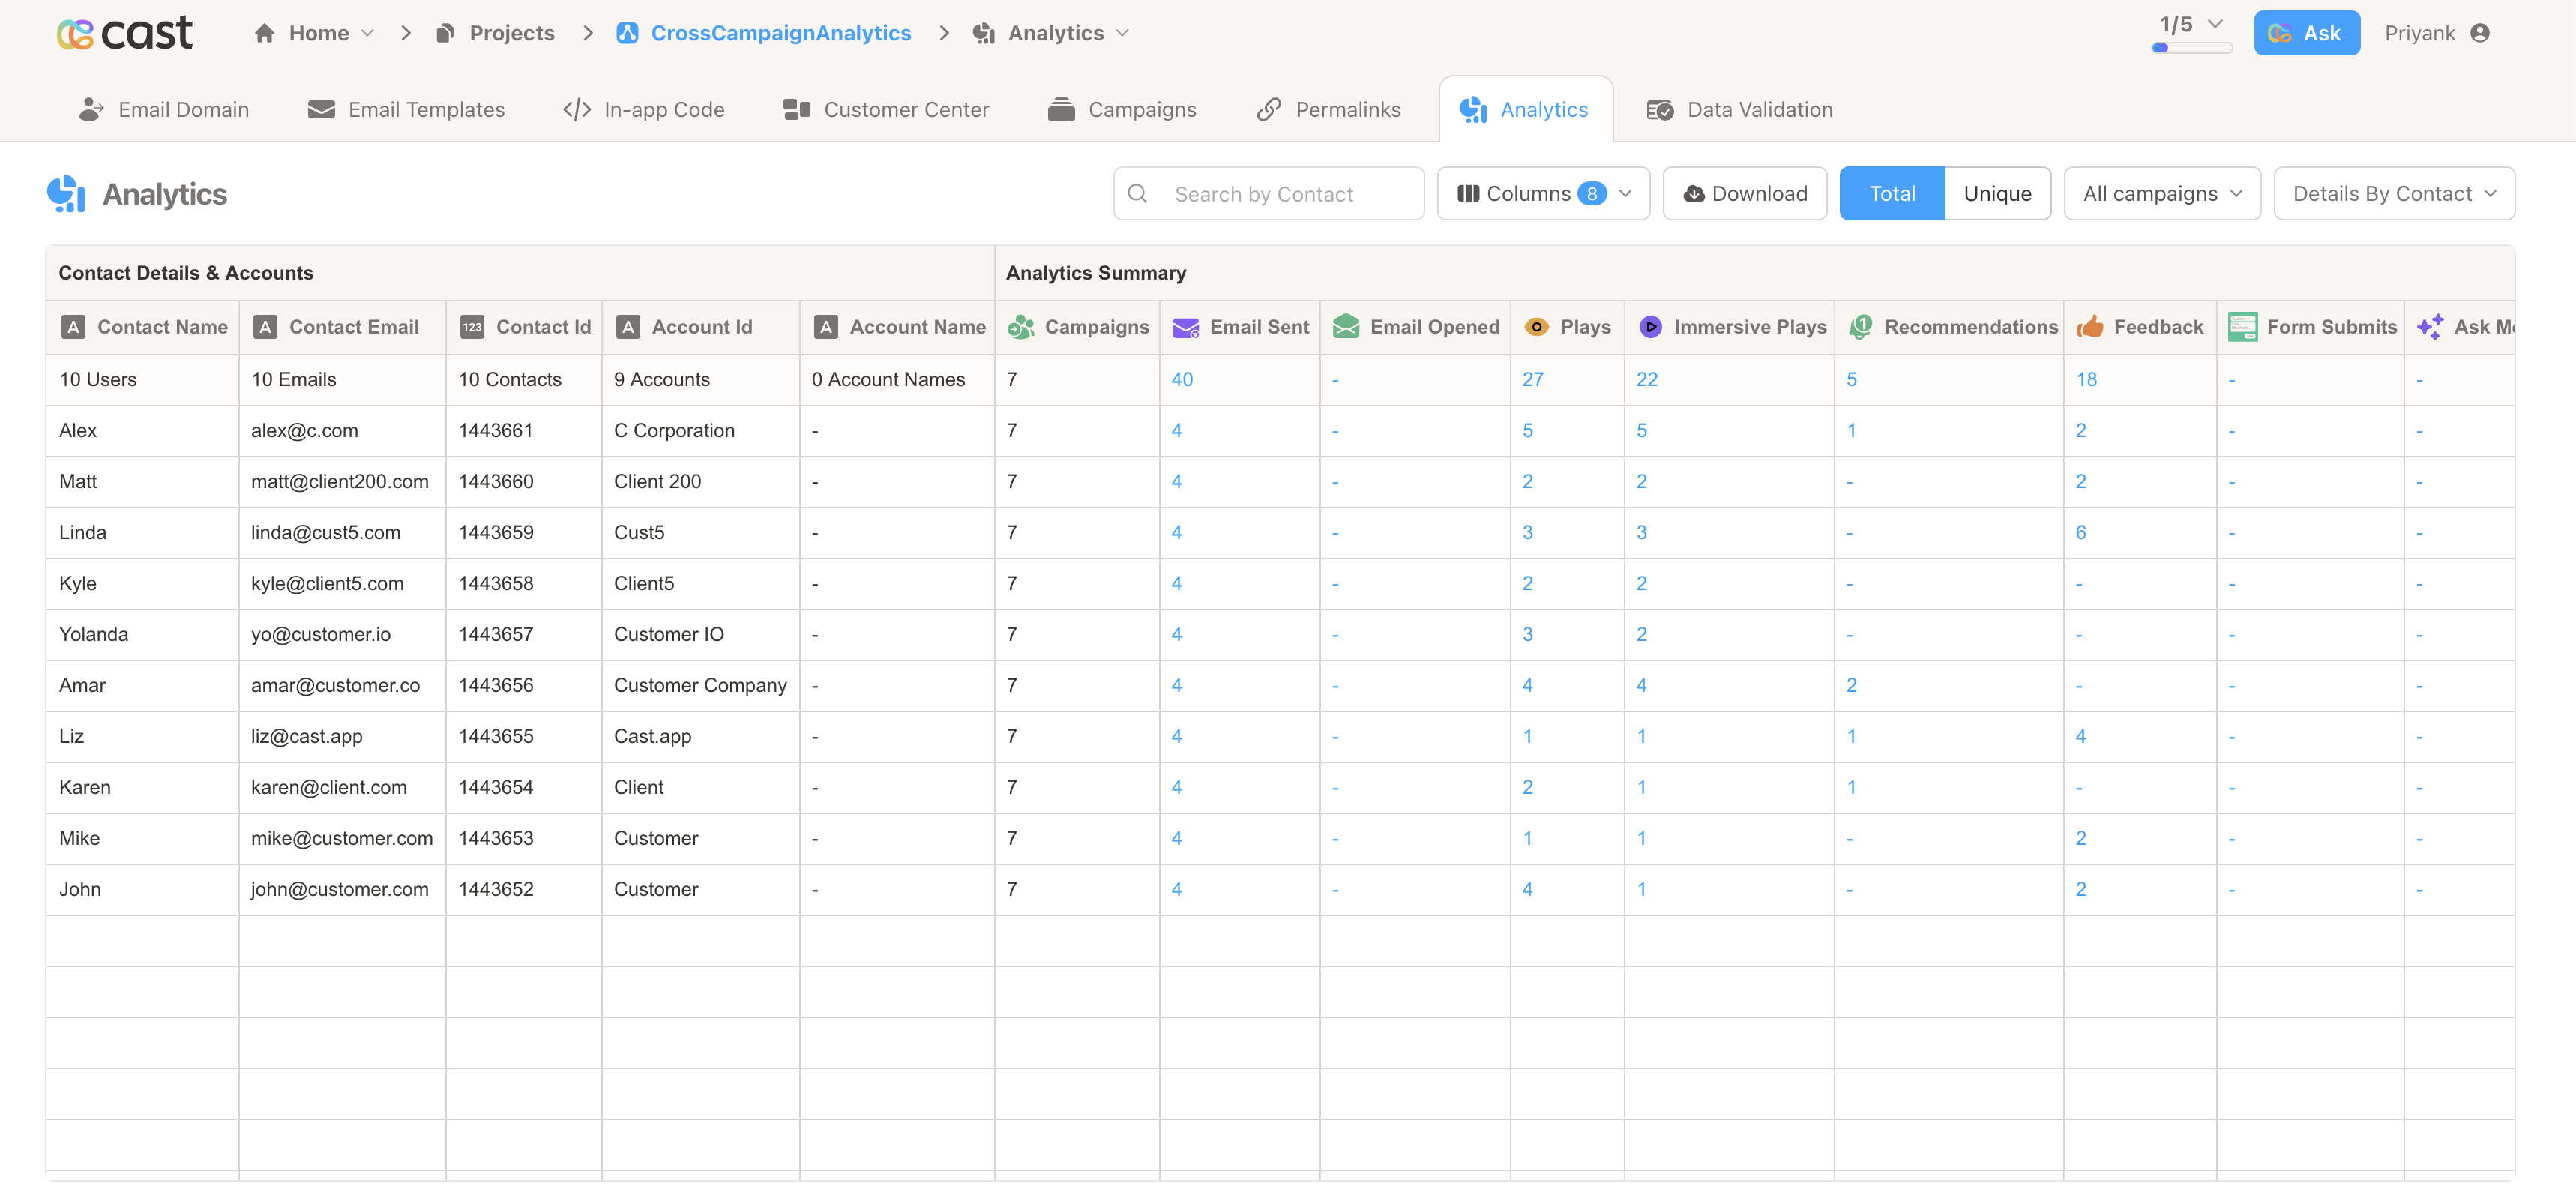
Viewing menu
Section titled “Viewing menu”Open the Viewing dropdown to control how analytics are presented.
| Setting | Options | Applies to |
|---|---|---|
| View | Overview / Details | Which page layout you see |
| Break Down By | By Contact / By Account | Both Overview and Details |
| Count Type | Total / Unique | Details only (disabled on Overview) |
By Contact — one row per individual contact. Search by contact name, email, contact ID, account ID, or account name.
By Account — one row per account with metrics aggregated across all contacts in that account. Search by account ID or account name only.
Event types tracked
Section titled “Event types tracked”The system tracks and displays multiple types of engagement events:
| Event Type | Description |
|---|---|
| Campaigns | Number of campaigns a contact participates in |
| Email sent | Emails queued for delivery |
| Email delivered | Successful email deliveries |
| Email not delivered | Failed, bounced, or dropped emails |
| Email opened | Email open events |
| Email clicked | Link clicks in email |
| Unsubscribe / spam report | Negative responses |
| Presentation views (Plays) | Presentation loads |
| Immersive plays | Interactive play engagement |
| Recommendations | Recommendation clicks |
| Feedback | Feedback submissions |
| Form submits | Form completions |
| AMA chats | Ask Me Anything interactions |
Campaign filtering
Section titled “Campaign filtering”Use the Campaign filter to choose which campaigns are included in your analytics.
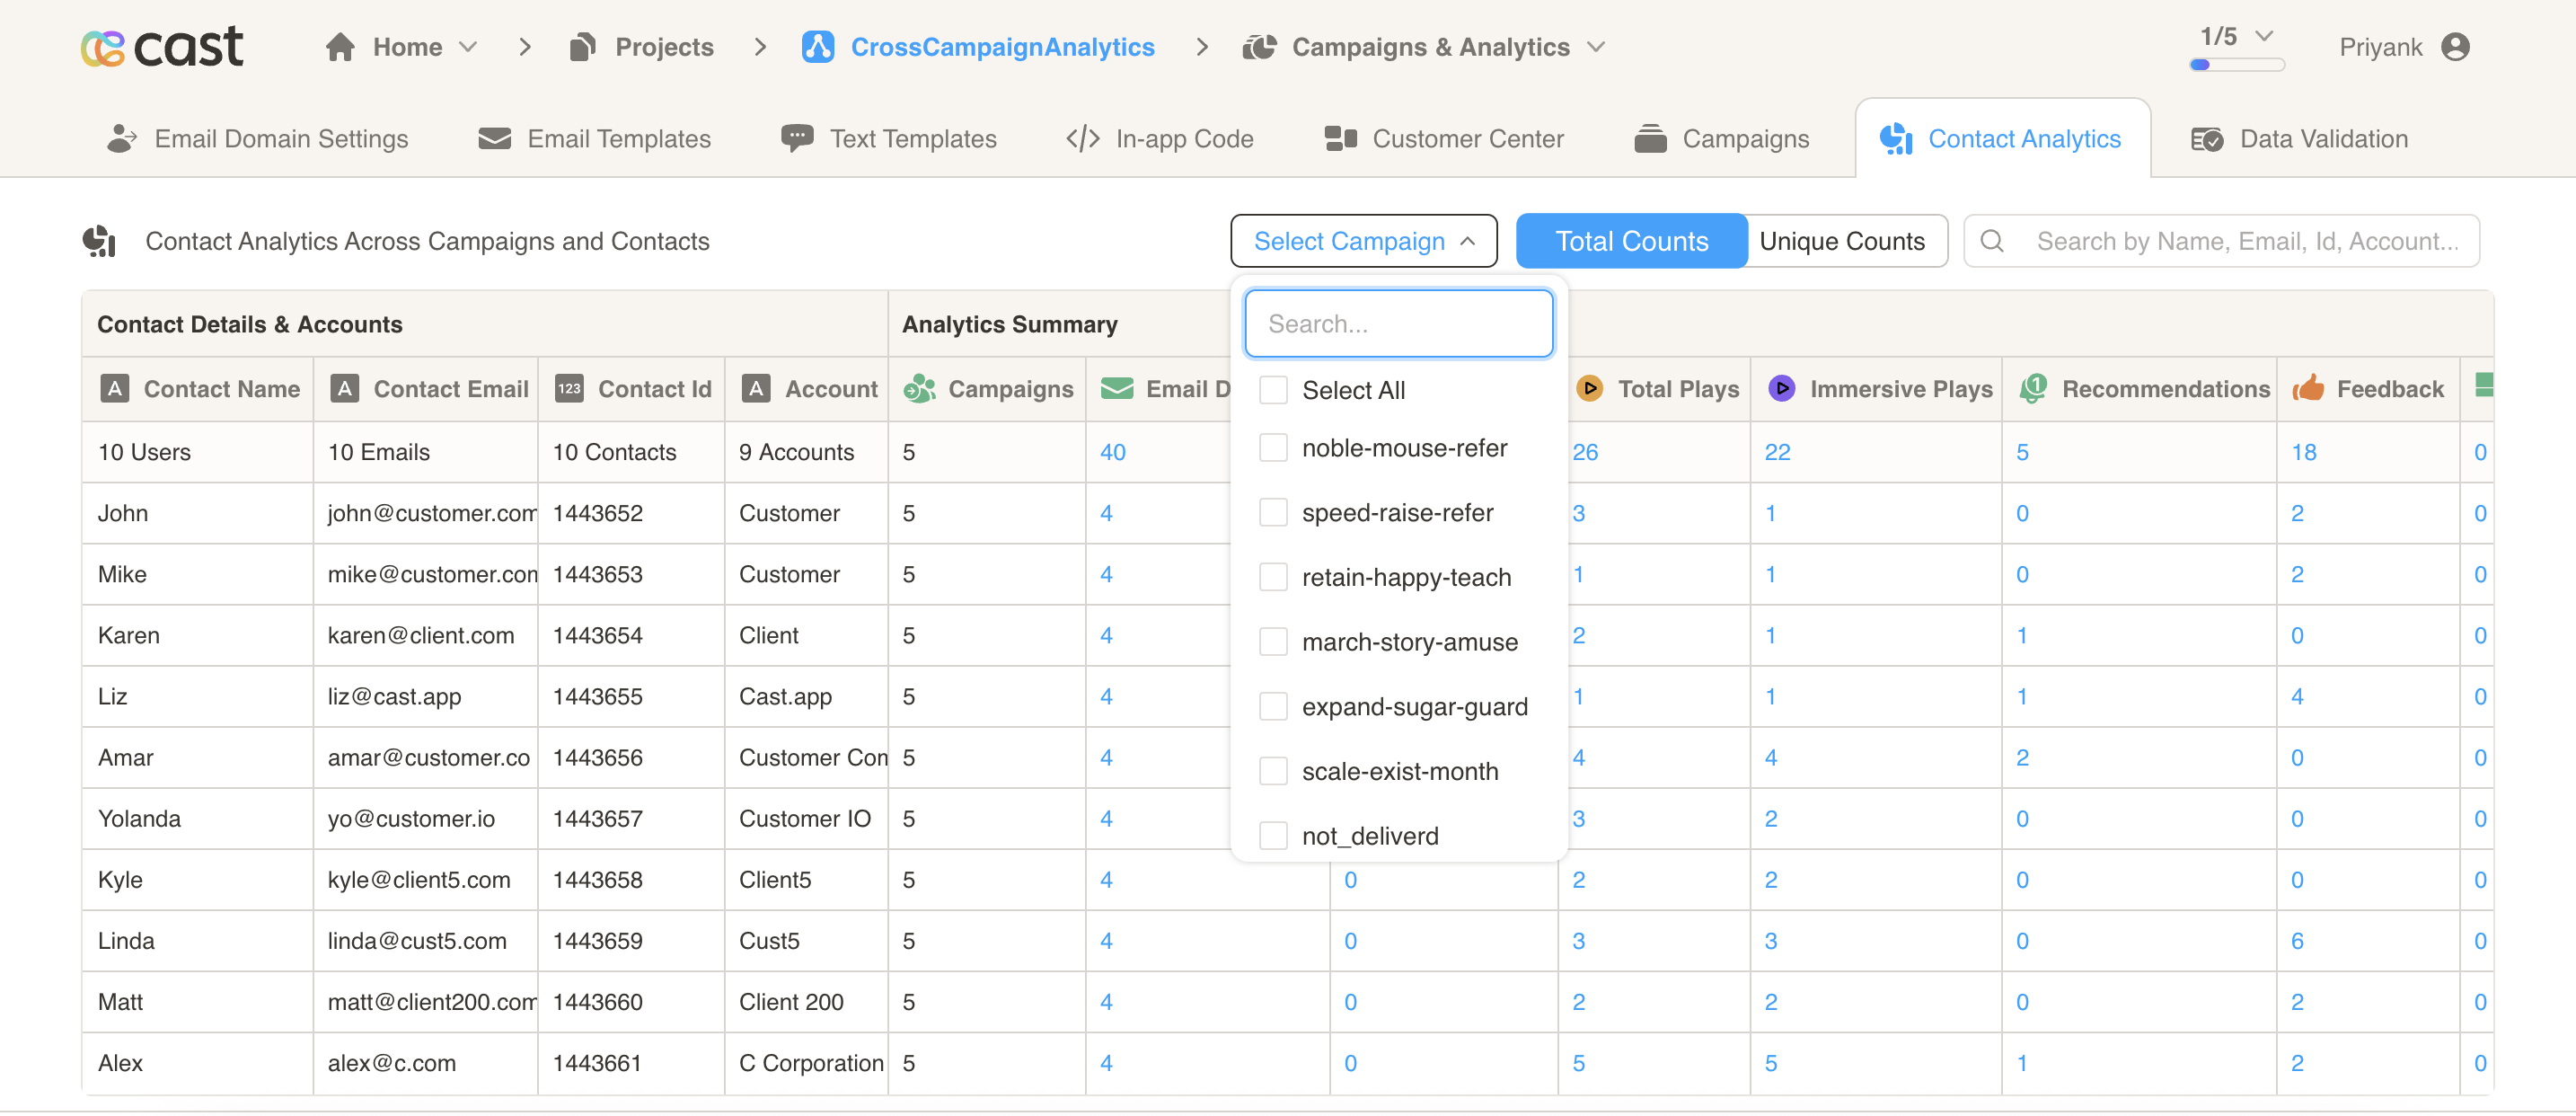
Campaign selector
- Campaign search: Filter the campaign list by typing campaign names
- Campaign details: Hover over campaigns to see generation date, delivery date, and archive status
- Multi-select: Choose multiple campaigns using checkboxes
- Select all / Unselect all: Quick bulk selection
The selector shows Select Campaign when nothing is chosen, or the selected campaign name(s) when specific campaigns are active.
Campaign status filtering
Section titled “Campaign status filtering”Use the Campaign Filters dropdown to filter analytics by campaign status and delivery dates:
- Show all: All campaigns regardless of status
- Show delivered: Only campaigns that have been delivered
- Time period selection: Last 30 / 90 / 180 days, quarterly periods, or a custom date range
- Show archived: Only archived campaigns
The filter label reflects your selection (for example, “Delivered in last 30 days”).
Filter choices are reflected in the page URL, so you can bookmark or refresh without losing your current view.
Total vs unique counts
Section titled “Total vs unique counts”On Overview: Total and unique counts appear together on the same metrics (for example, email sent shows the total on the main line and “N unique” below). You do not switch Count Type on Overview.
On Details: Use Count Type in the Viewing menu:
- Total counts: Cumulative event counts (every event row counts, including repeats)
- Unique counts: Each contact or account counts once per event type, regardless of how many campaigns they appear in
The Details grid includes a summary row at the bottom with column totals that respect your current filters and Count Type setting.
Search and filtering
Section titled “Search and filtering”Use the search box at the top of the page to find specific contacts or accounts. Search updates as you type.
When viewing By Contact:
- Contact name
- Email address
- Contact ID
- Account ID
- Account name
When viewing By Account:
- Account ID
- Account name only
Note: In By Account view, contact-specific fields (name, email, contact ID) are not searchable.
You can also filter by campaigns using the Campaign selector (see Campaign filtering above).
Detailed event analysis
Section titled “Detailed event analysis”Click any metric in the Details grid, or clickable numbers and charts on Overview, to open the Event Details modal.
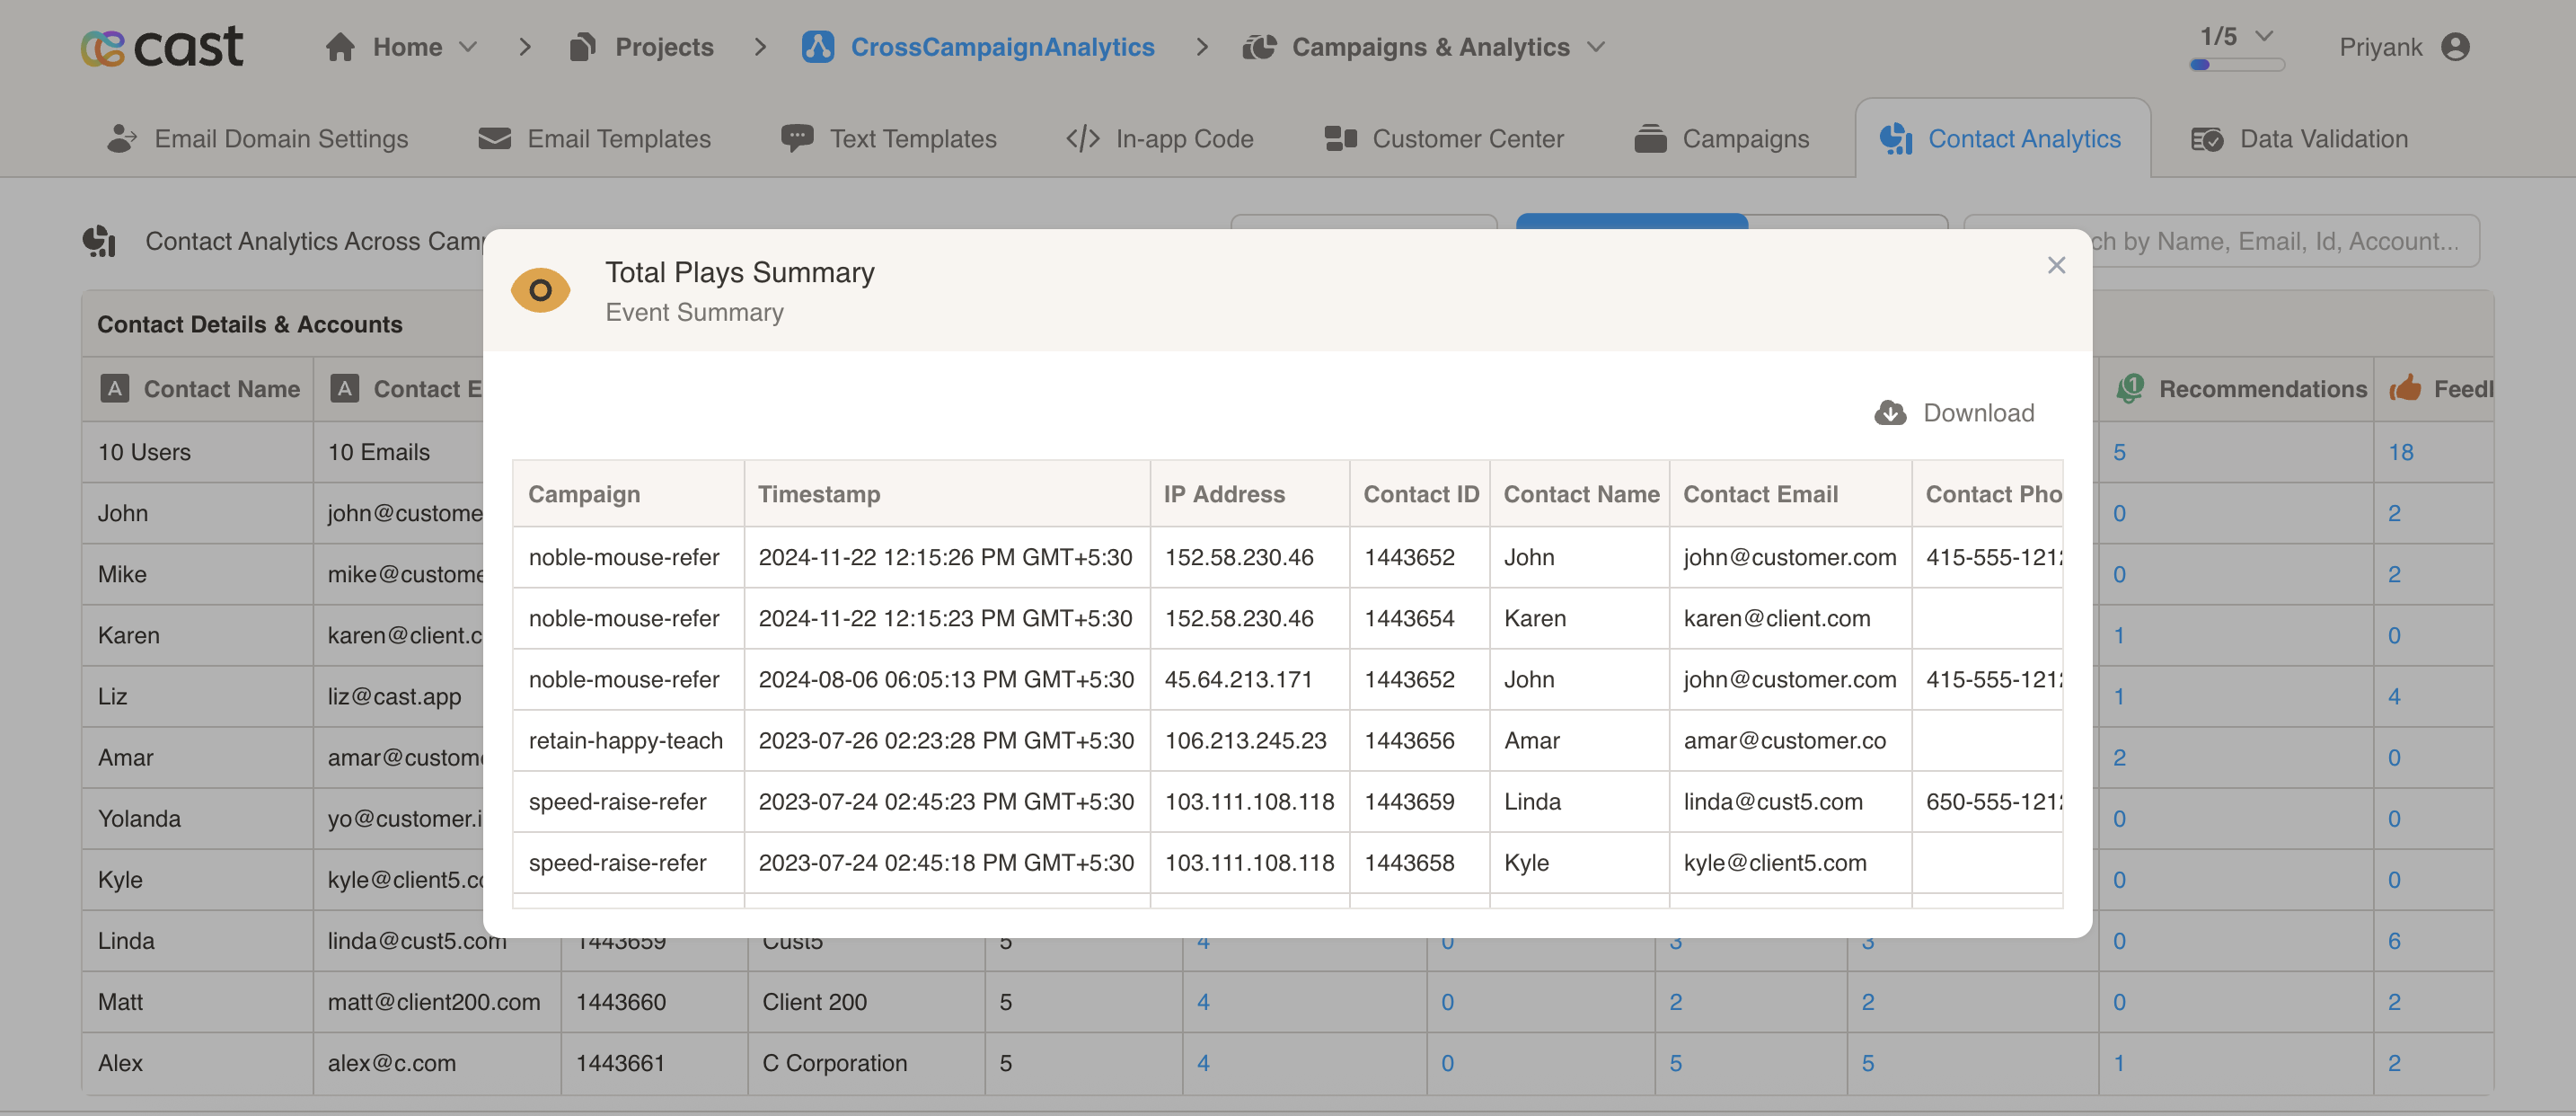
From a contact or account row (Details):
- Complete event history for the selected contact or account
- Timestamps, device and browser information, and campaign context
From an Overview metric or funnel step:
- All matching events for the current filters
- Sortable, paginated table
Event detail columns vary by event type — email delivery status, feedback ratings, form field values, recommendation titles, and more.
Data export
Section titled “Data export”Use the Download button in the filter bar. The export matches your current filters, search, and Break Down By setting.
| View | What downloads |
|---|---|
| Overview | Multi-worksheet Excel workbook (summary, funnel, top slides, top actions, platform, language, and more) |
| Details | Excel spreadsheet of the contact/account grid |
On Details, the export respects your Count Type (Total or Unique) setting.
You can also export from some event detail modals for a focused slice of raw events.
- Start on Overview for program health; switch to Details for contact-level follow-up.
- Scope to one campaign by selecting it in the campaign filter, or open that campaign’s Analytics tab for a direct link.
- Use By Account for B2B reporting when multiple contacts share one company.
- Bookmark a filtered URL to share a specific view with your team.