
Custom
 Custom Slide
Section titled “ Custom Slide”Create stunning, data-driven graphics that automatically personalize with user or account-specific data. The Custom slide is compatible with both static SVGs and animated SVGs with embedded CSS.
Dynamic elements and widgets at a glance
Section titled “Dynamic elements and widgets at a glance”Click a Prefix to jump to its full configuration. Click an image for a larger preview.
| Prefix | When to use | Example image | Sample Data | Sample SVG |
|---|---|---|---|---|
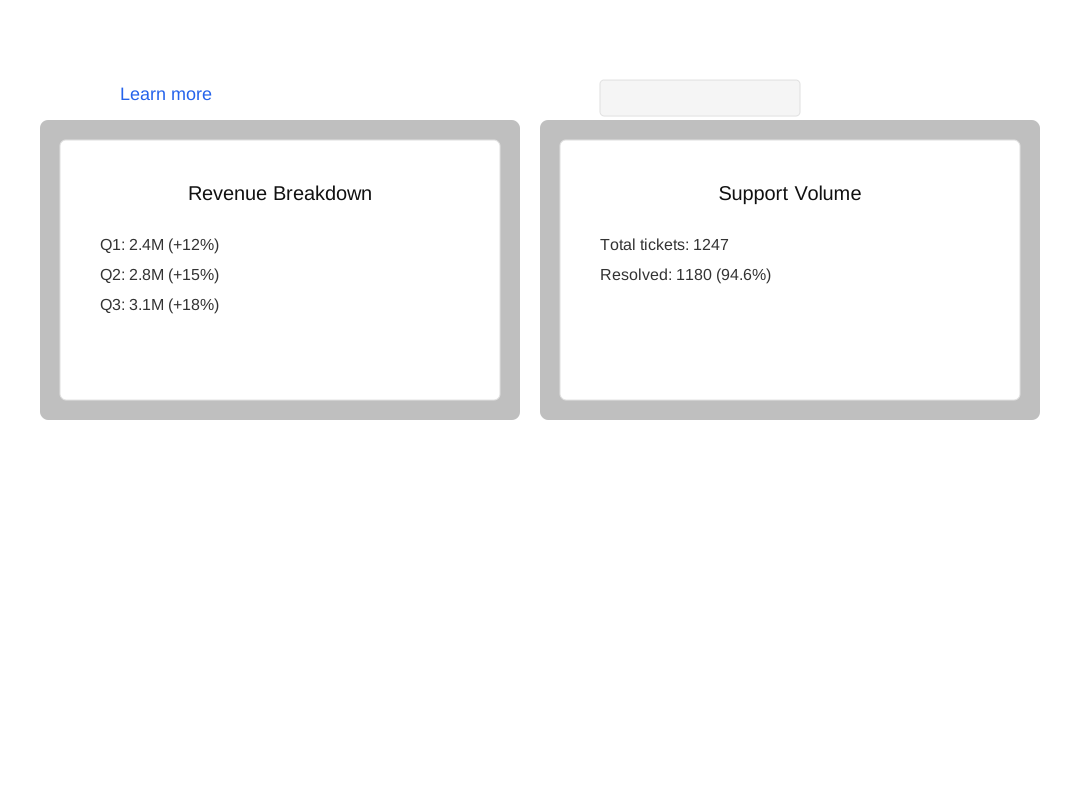
| lc_action / lc_target | Click-to-reveal overlay with frosted-glass modal and TTS narration. | 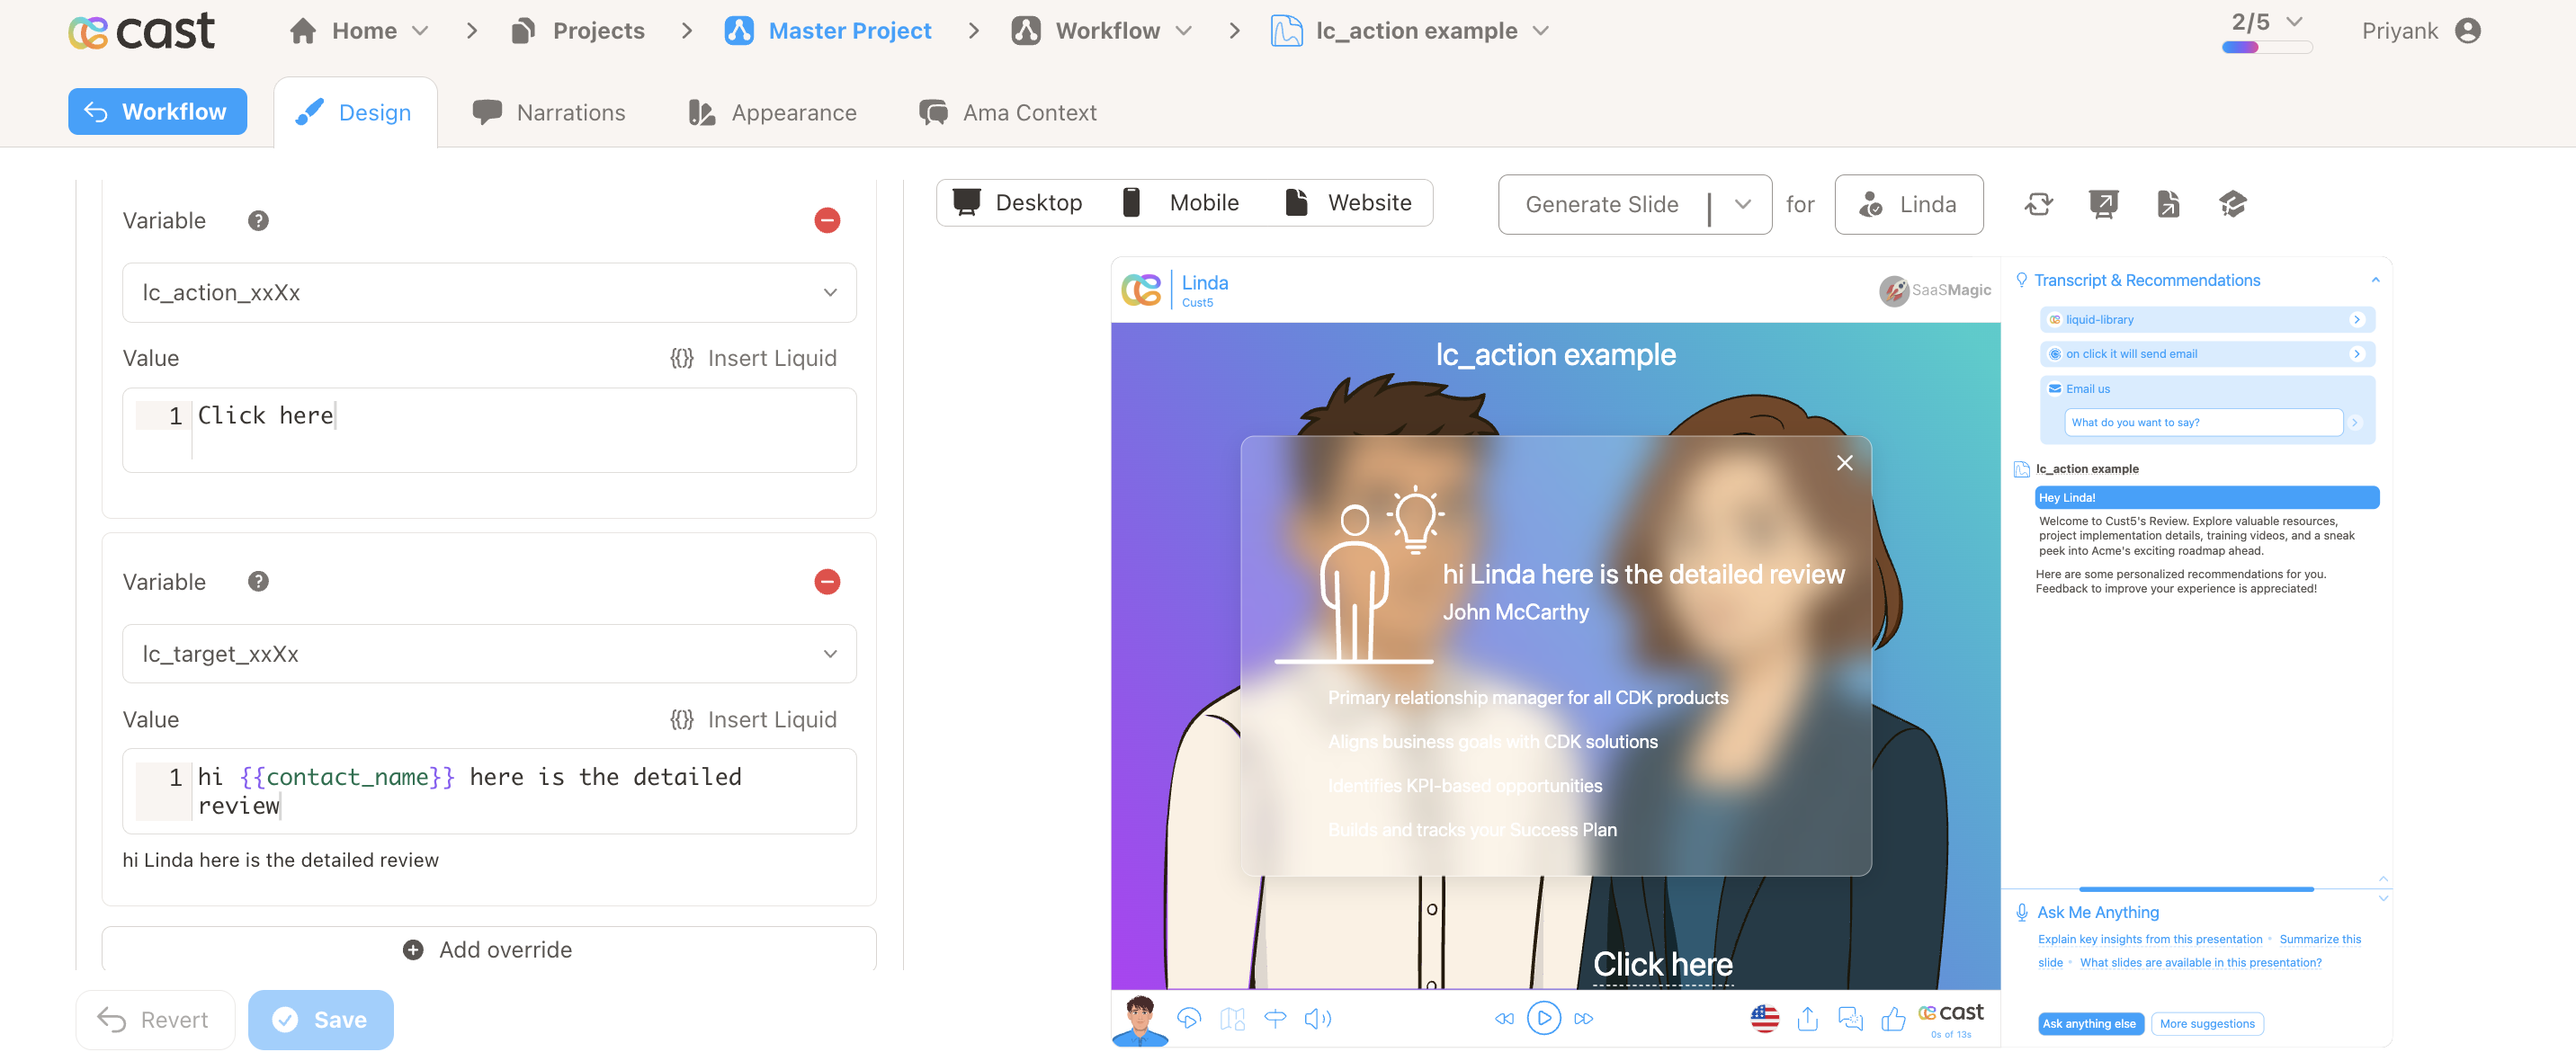 |
SVG | |
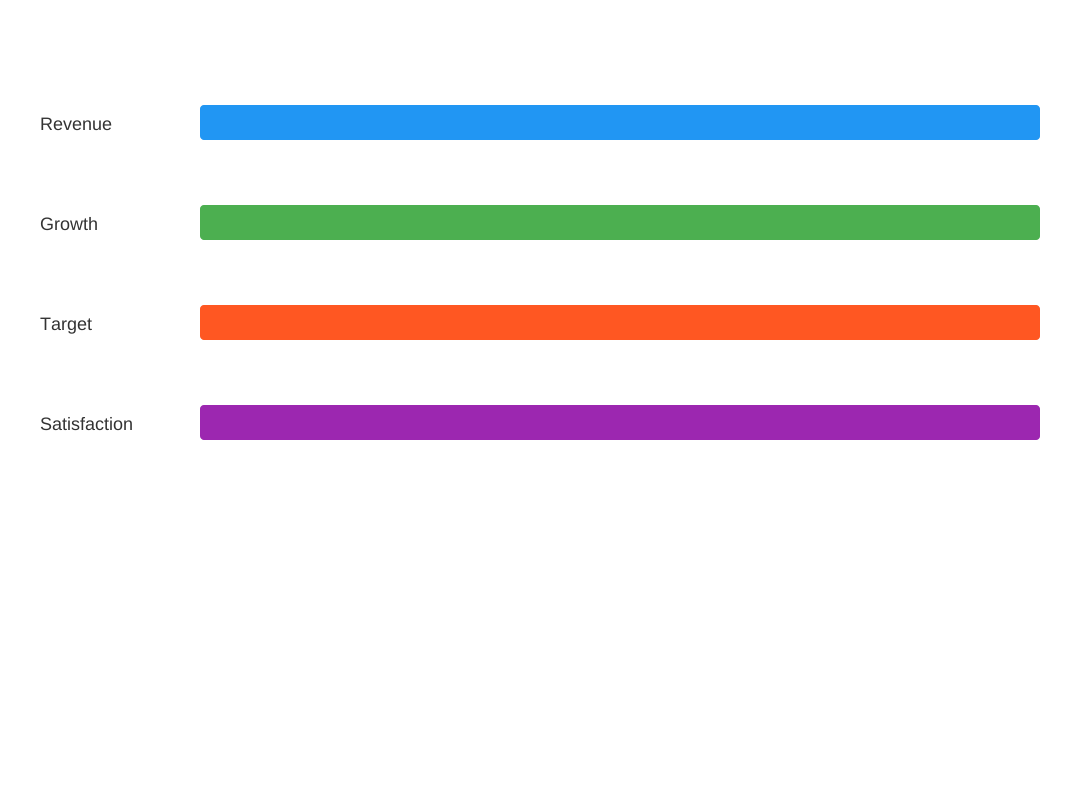
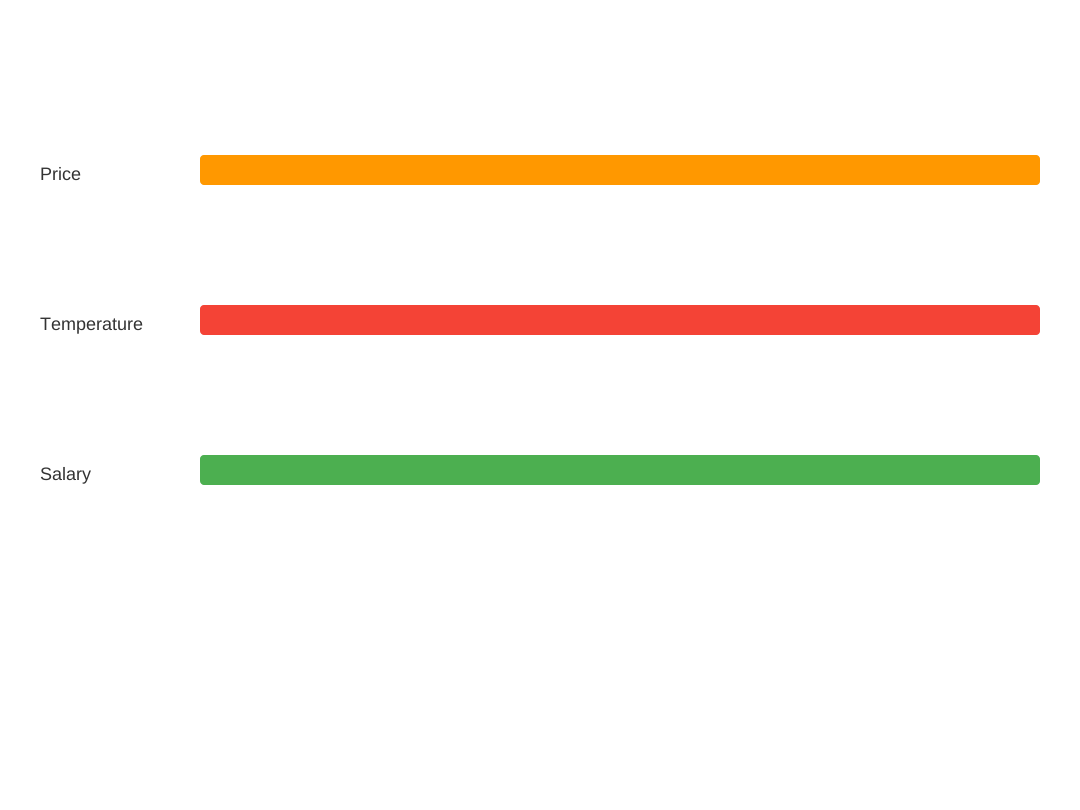
| lc_bar / lc_bar_bg | Horizontal bars for side-by-side comparison (e.g. revenue, KPIs). | 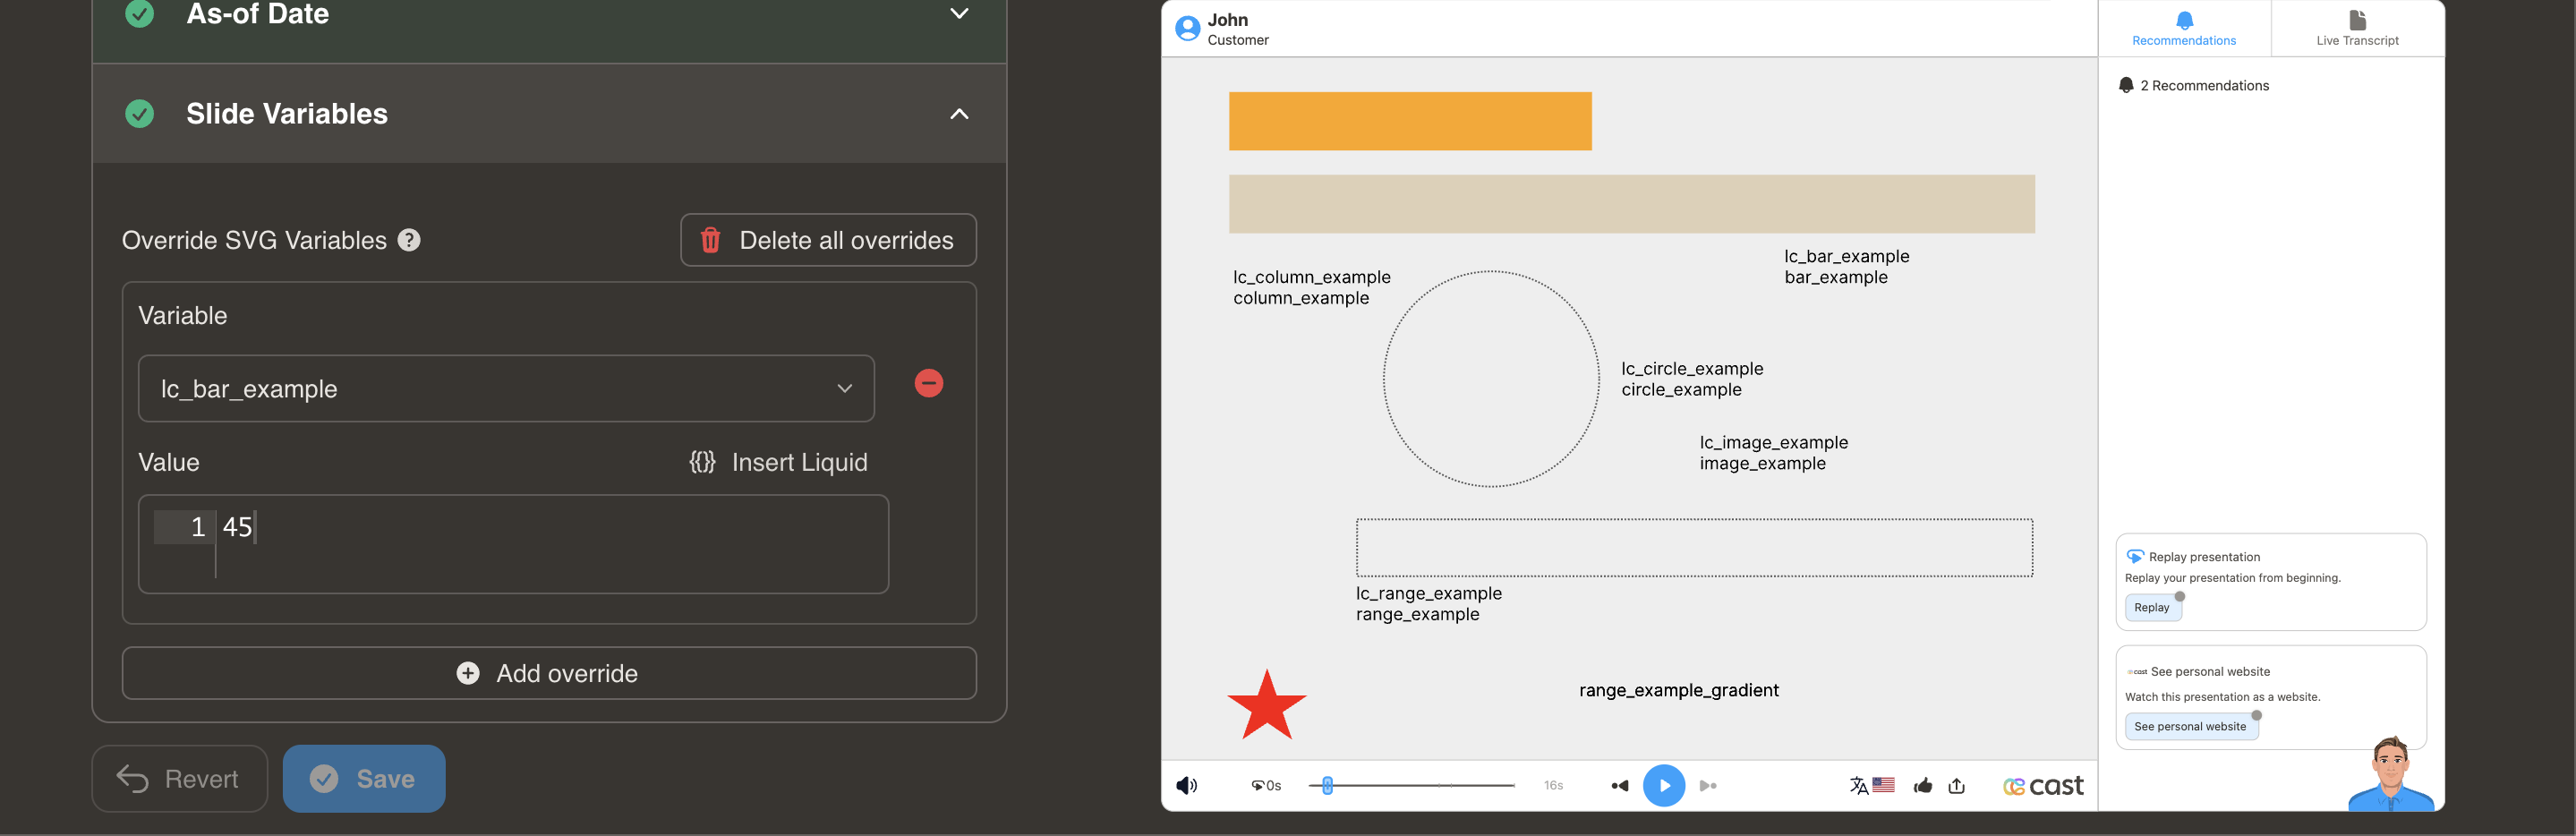 |
SVG | |
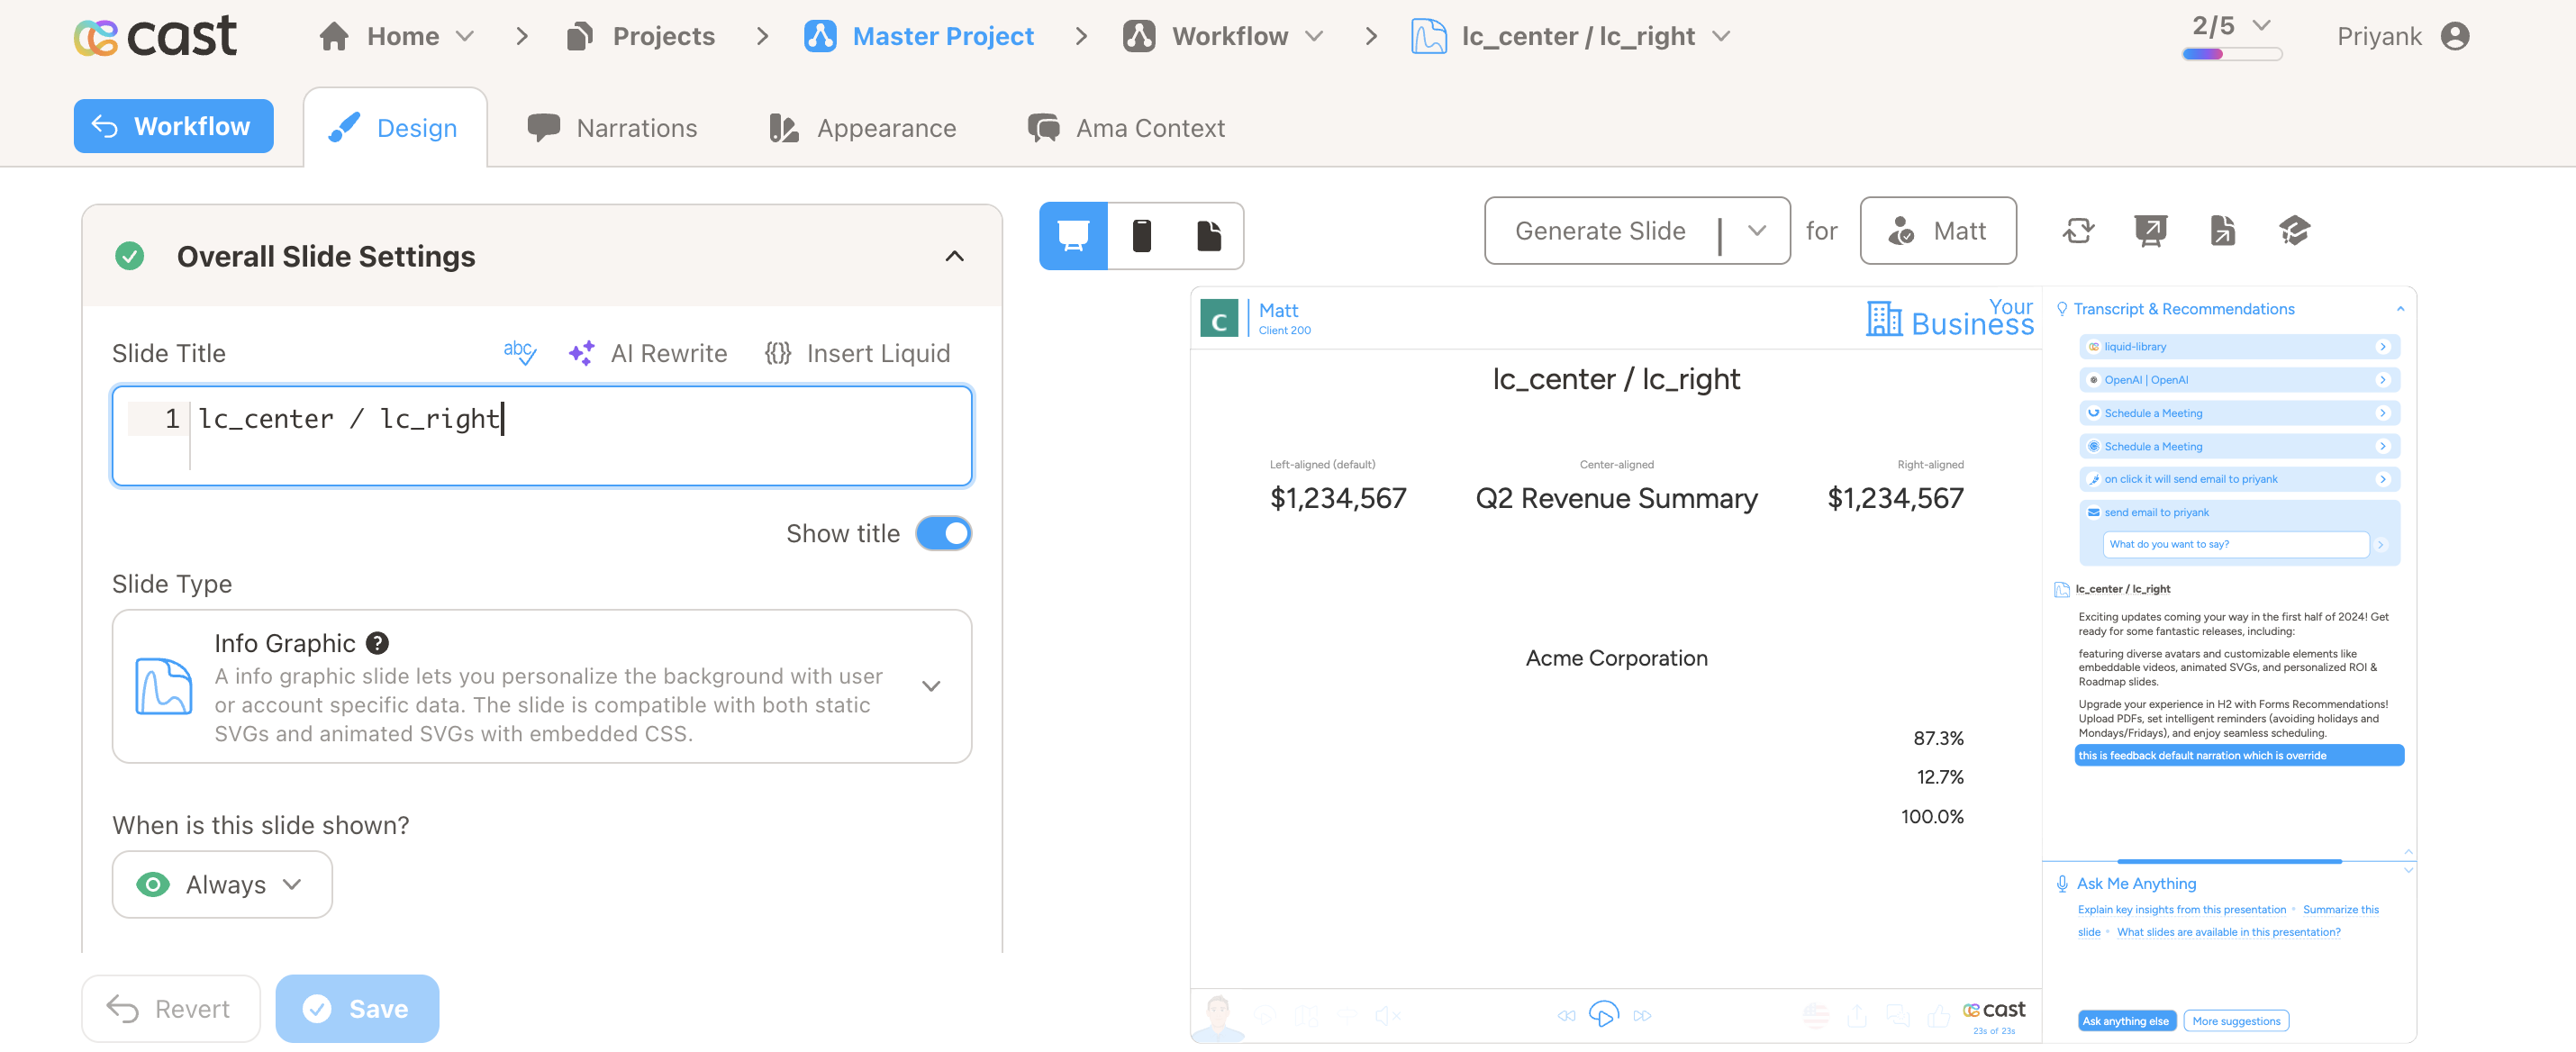
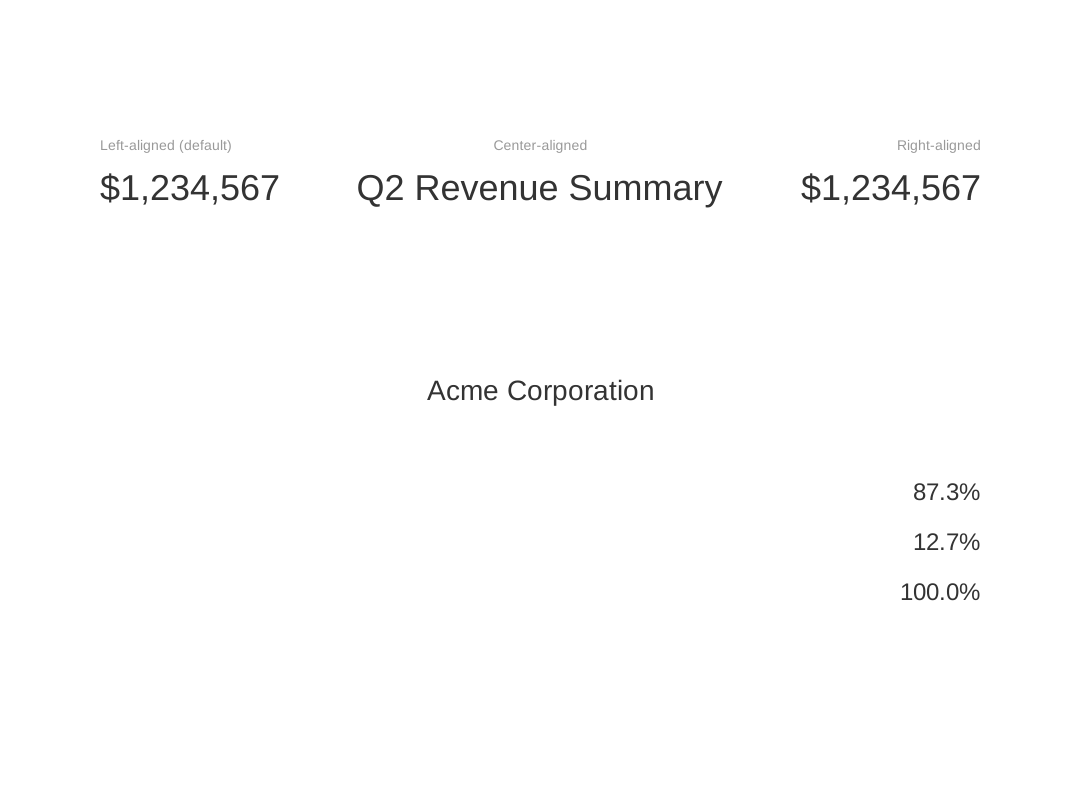
| lc / lc_center / lc_right | Left (default), center, or right-align dynamic text in SVG <text> elements using lc_left|center|right_text style IDs. |
 |
SVG | |
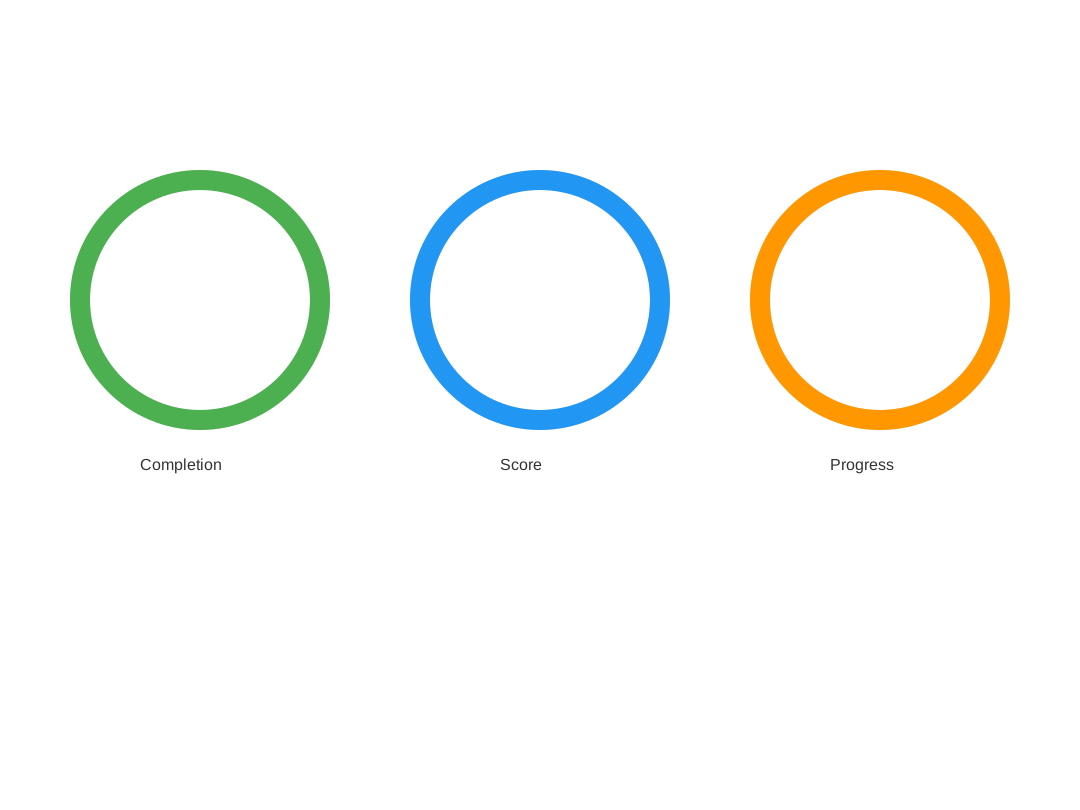
| lc_circle / lc_circle_bg | Single percentage or completion status (circular progress). | 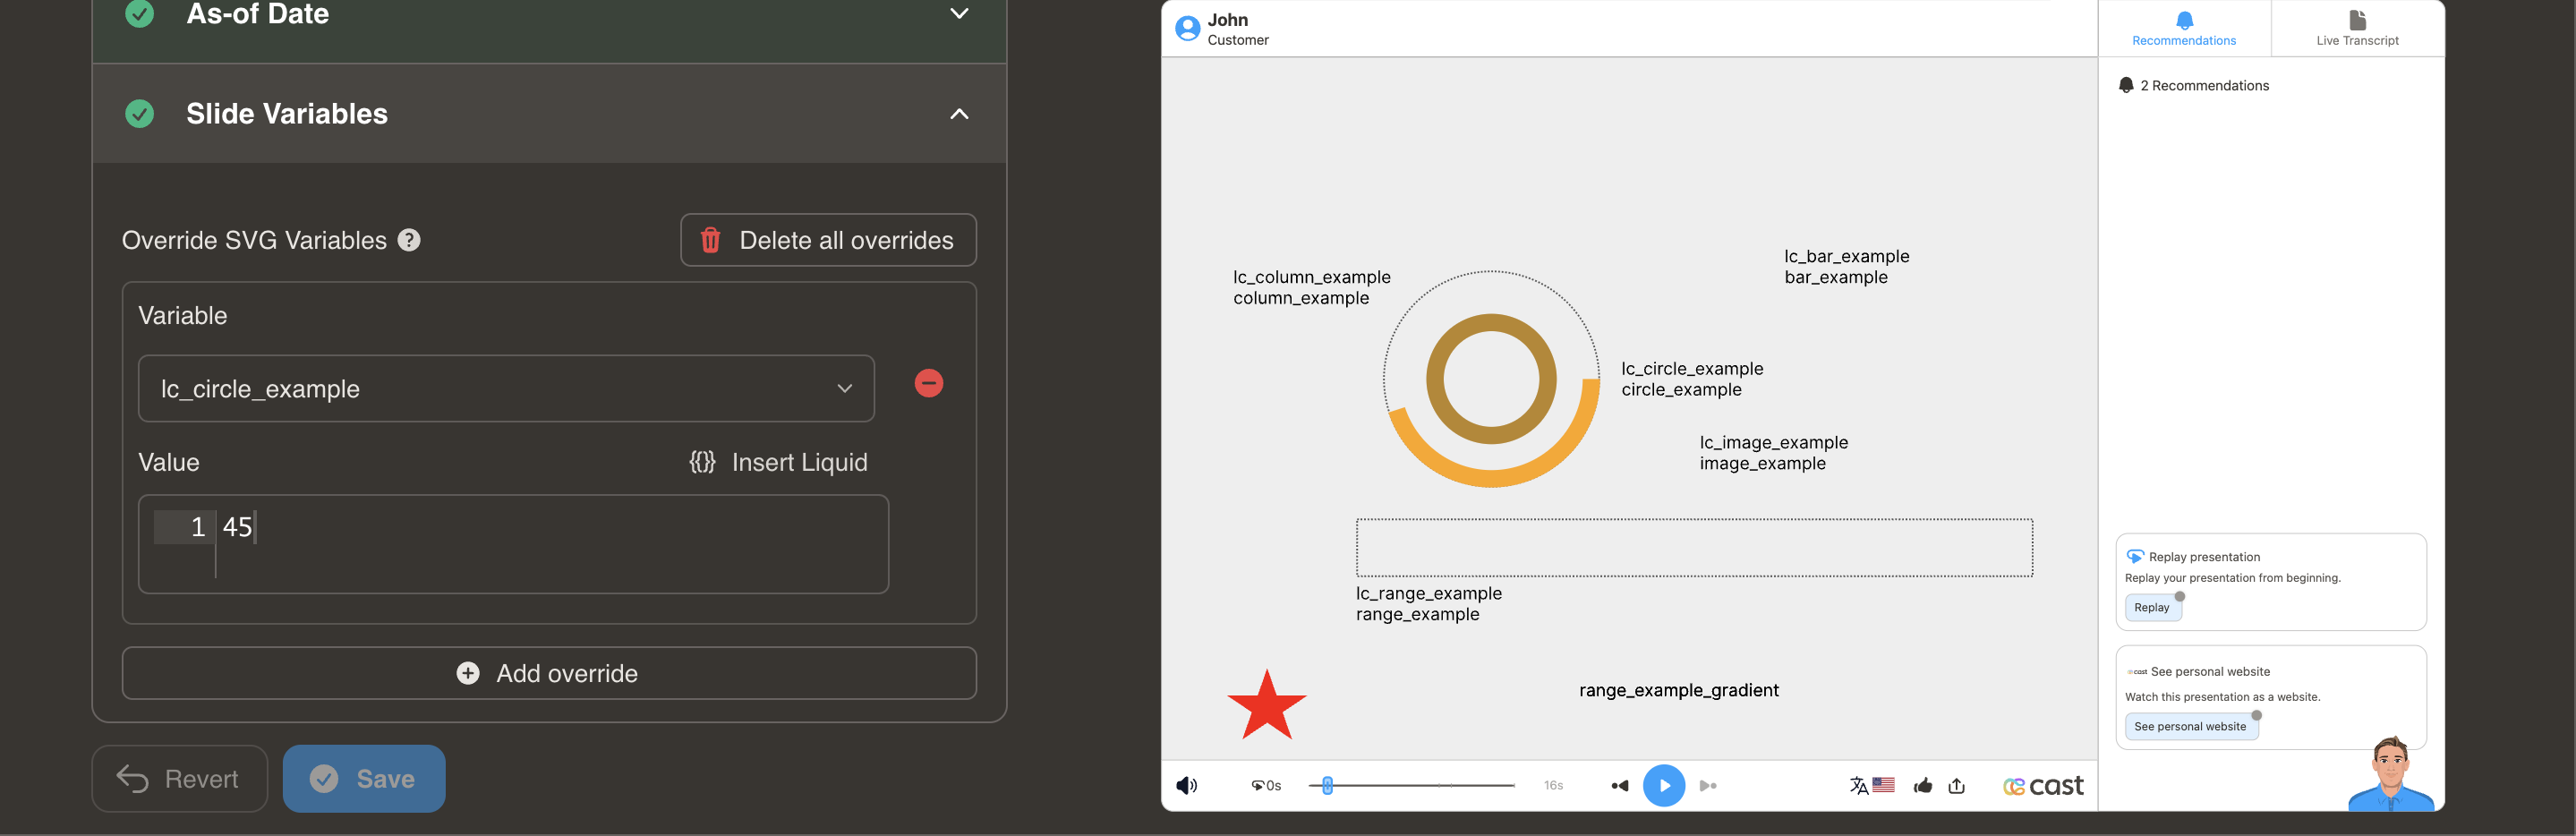 |
SVG | |
| lc_color | Change element colors from data (status, conditions). | 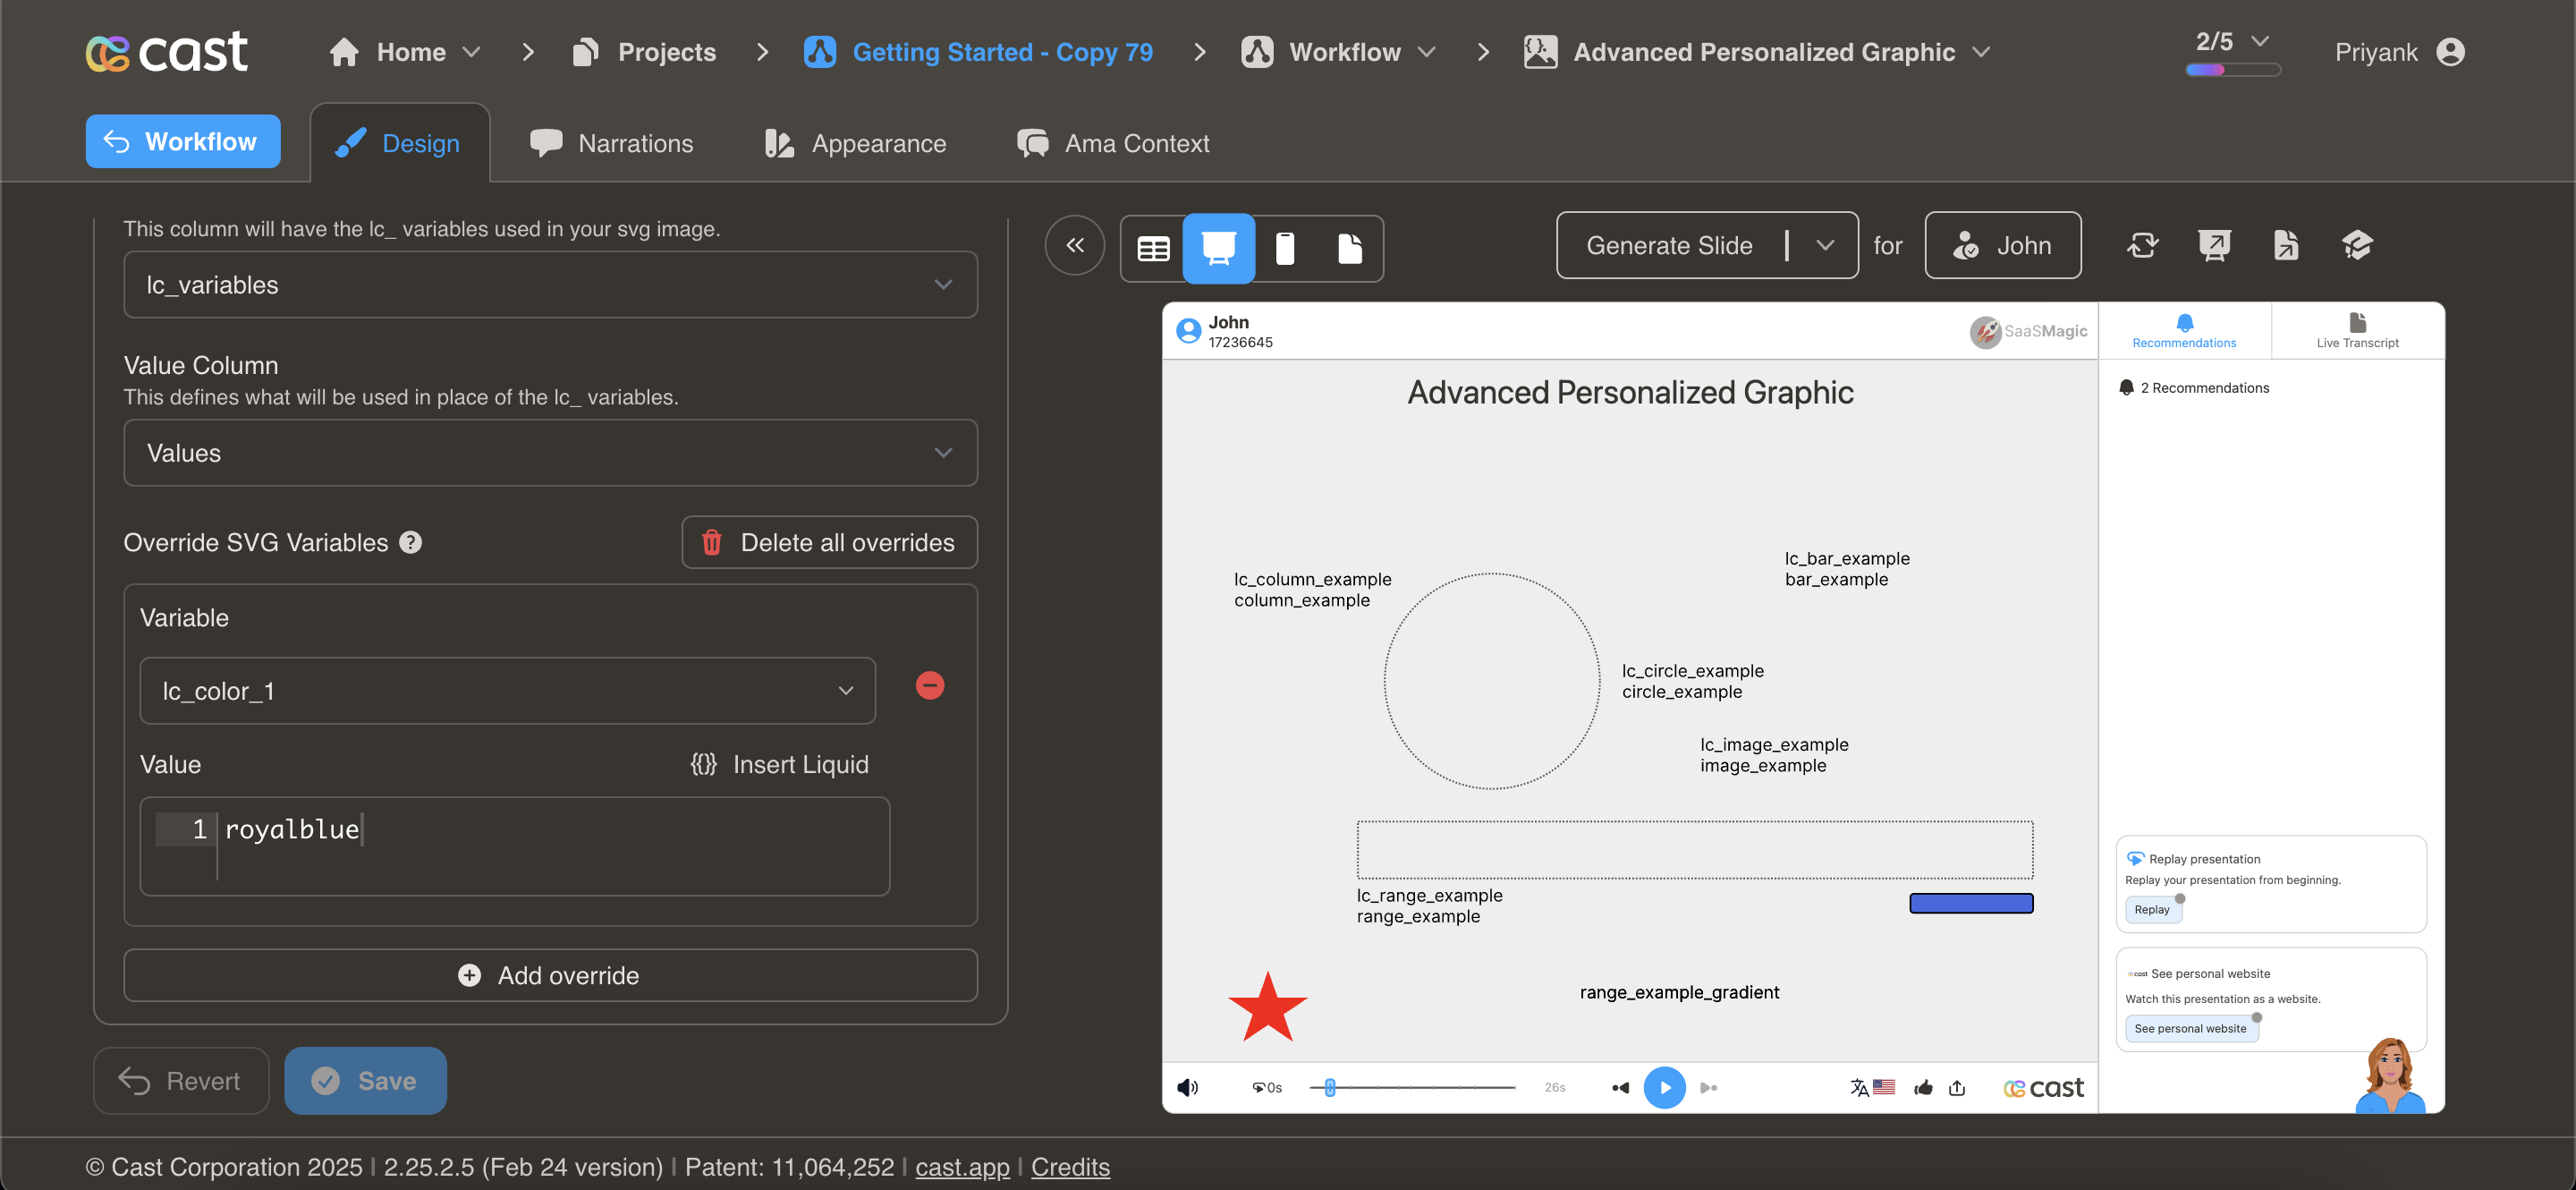 |
SVG | |
| lc_column / lc_column_bg | Vertical columns for time series or rankings. | 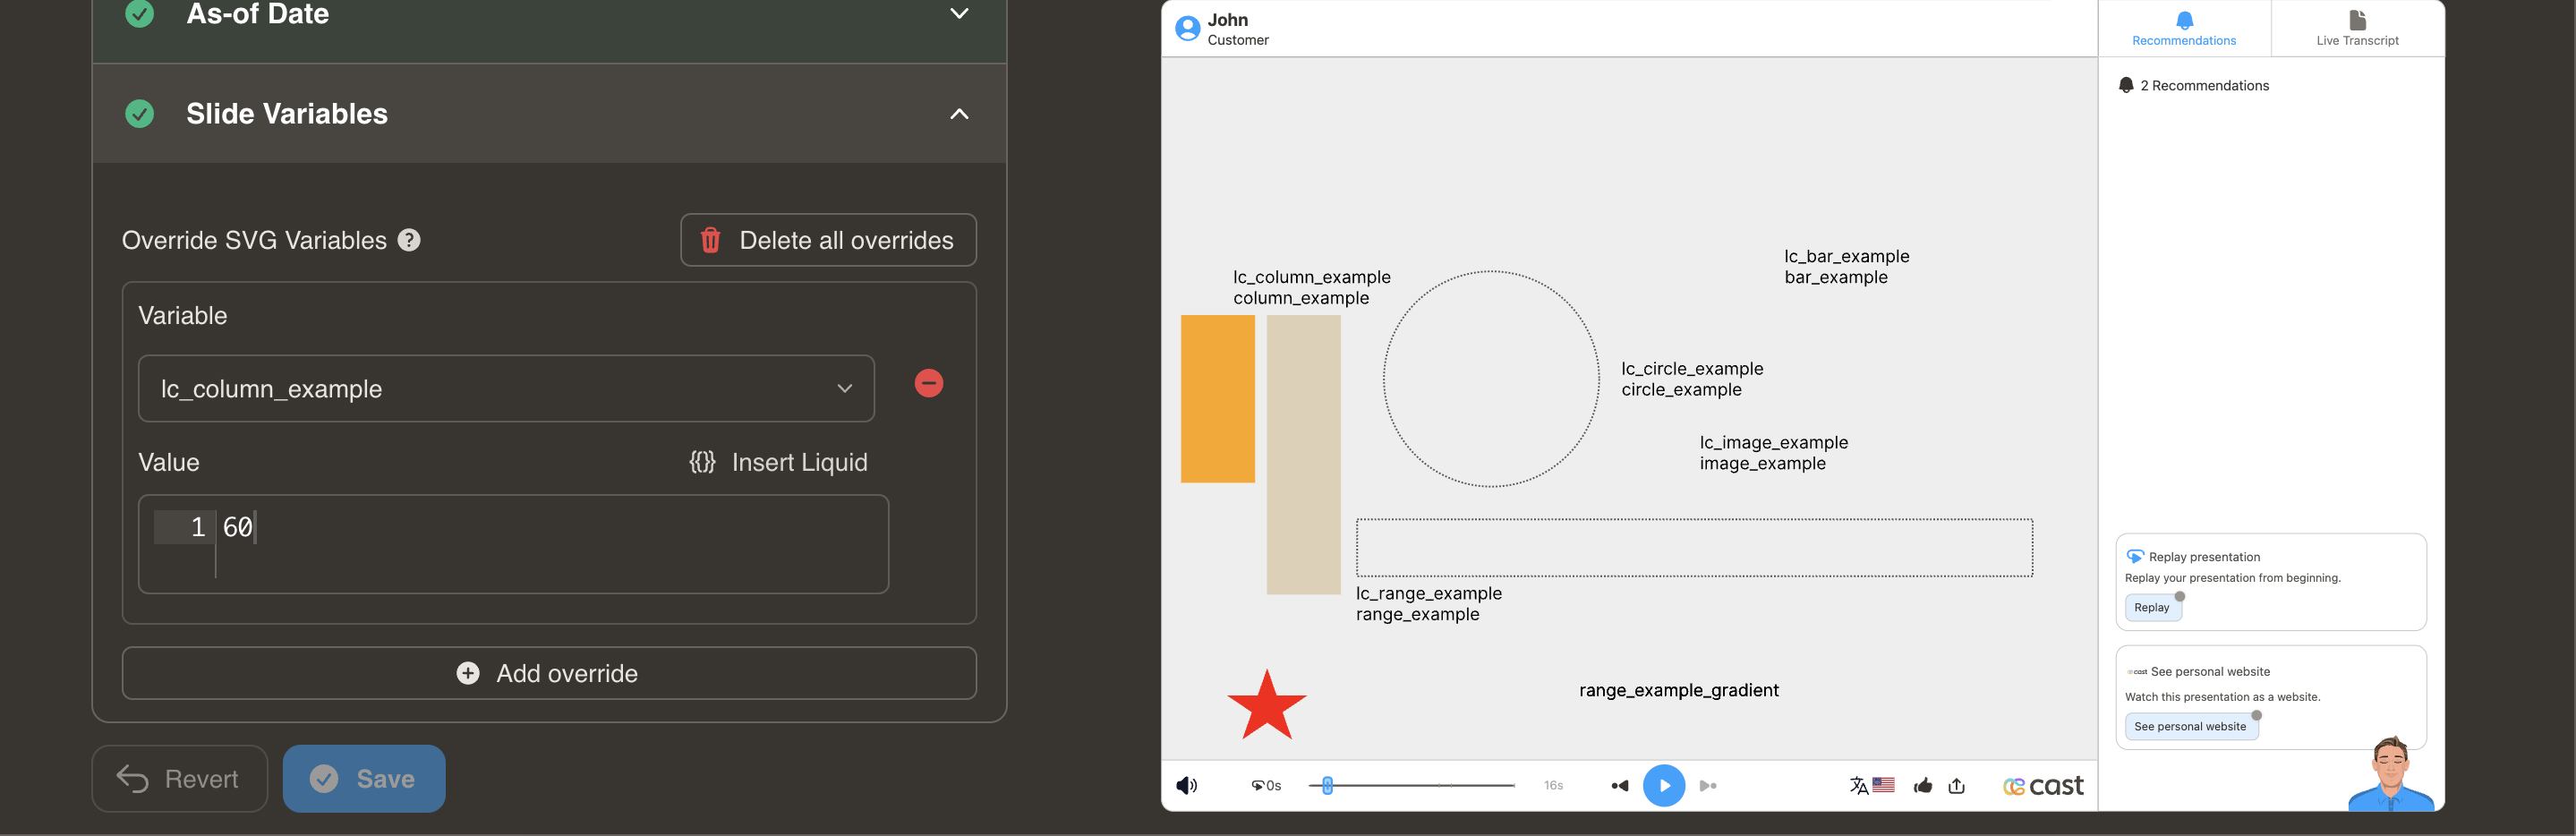 |
SVG | |
| lc_date | Formatted dates (events, milestones, deadlines). | 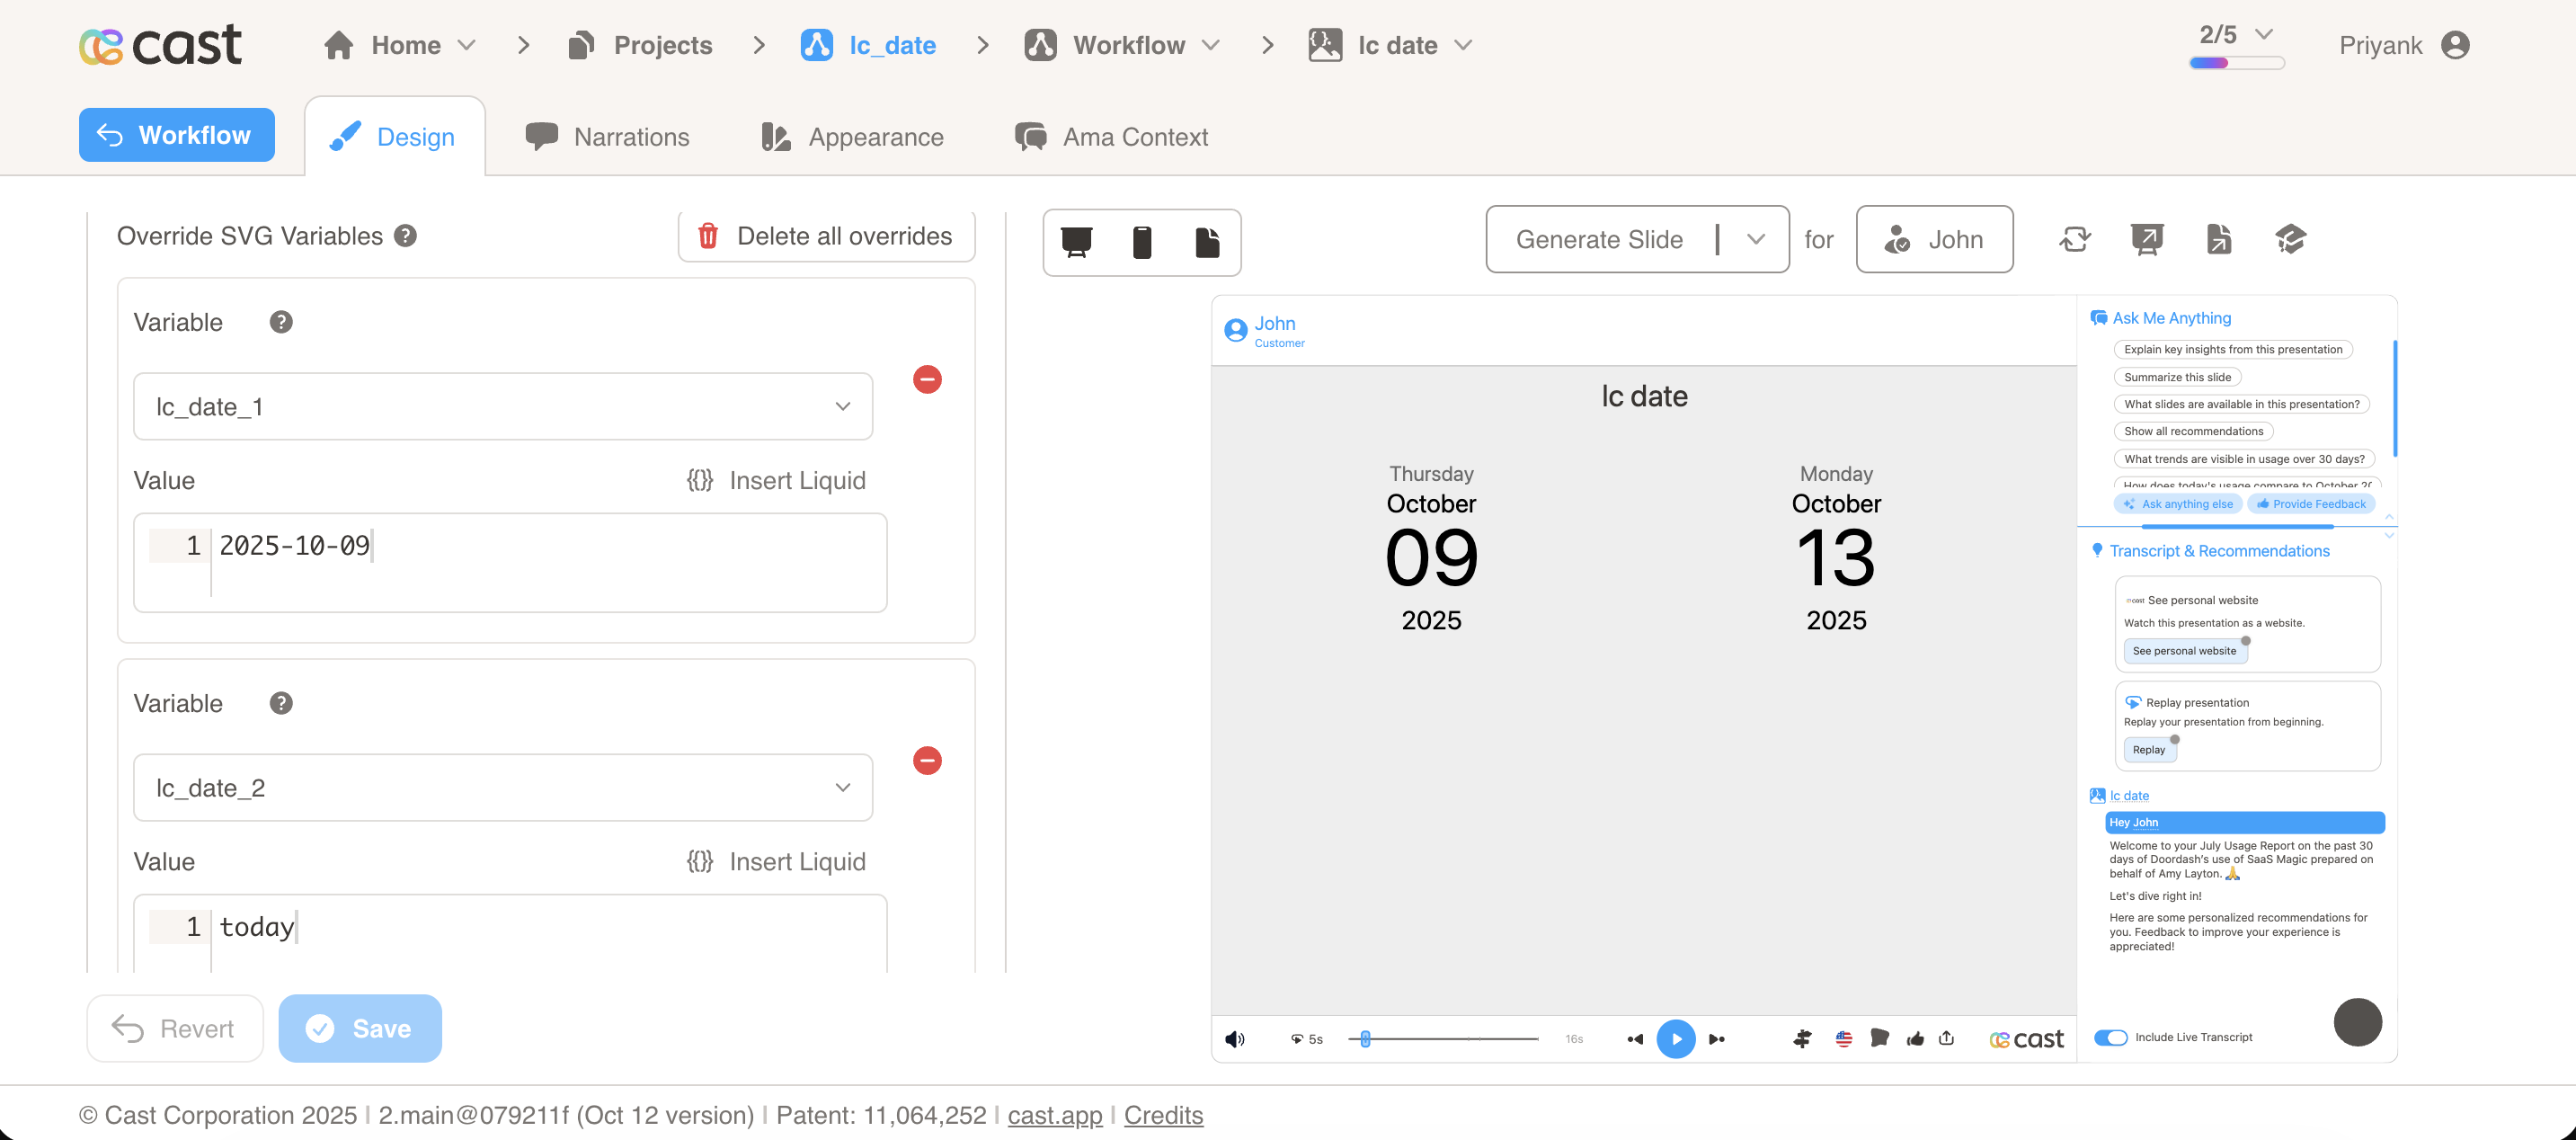 |
SVG | |
| lc_days_of_month | Calendar-style charts of daily activity across a month. | 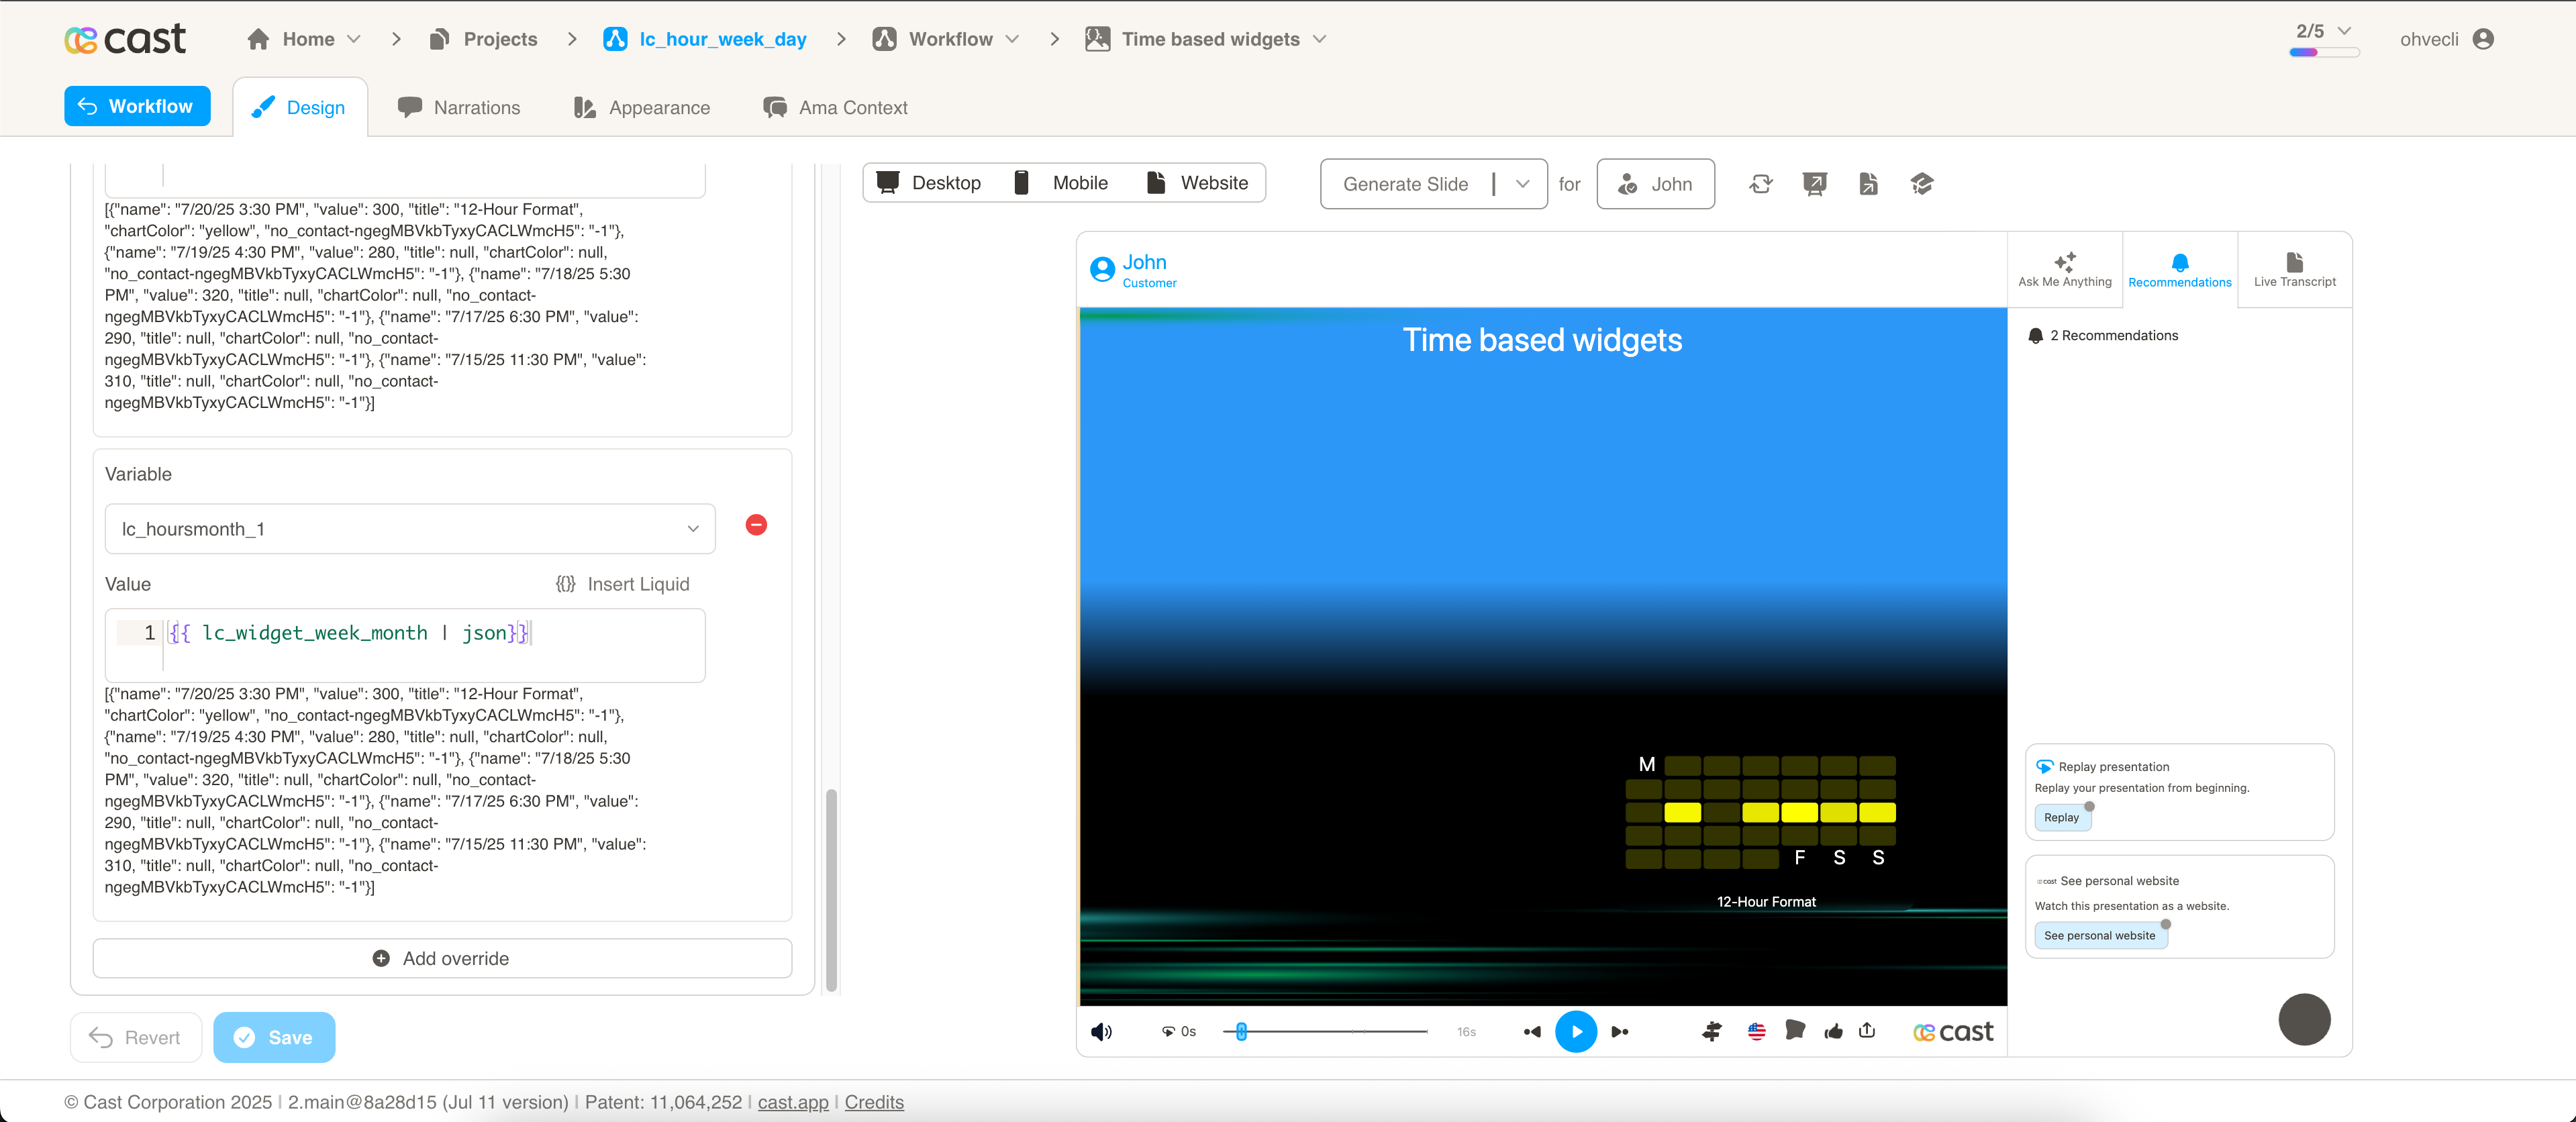 |
SVG | |
| lc_deeplink | Turns a shape or button into a one-click AMA question, link, email, call/text, or Zoom join. | 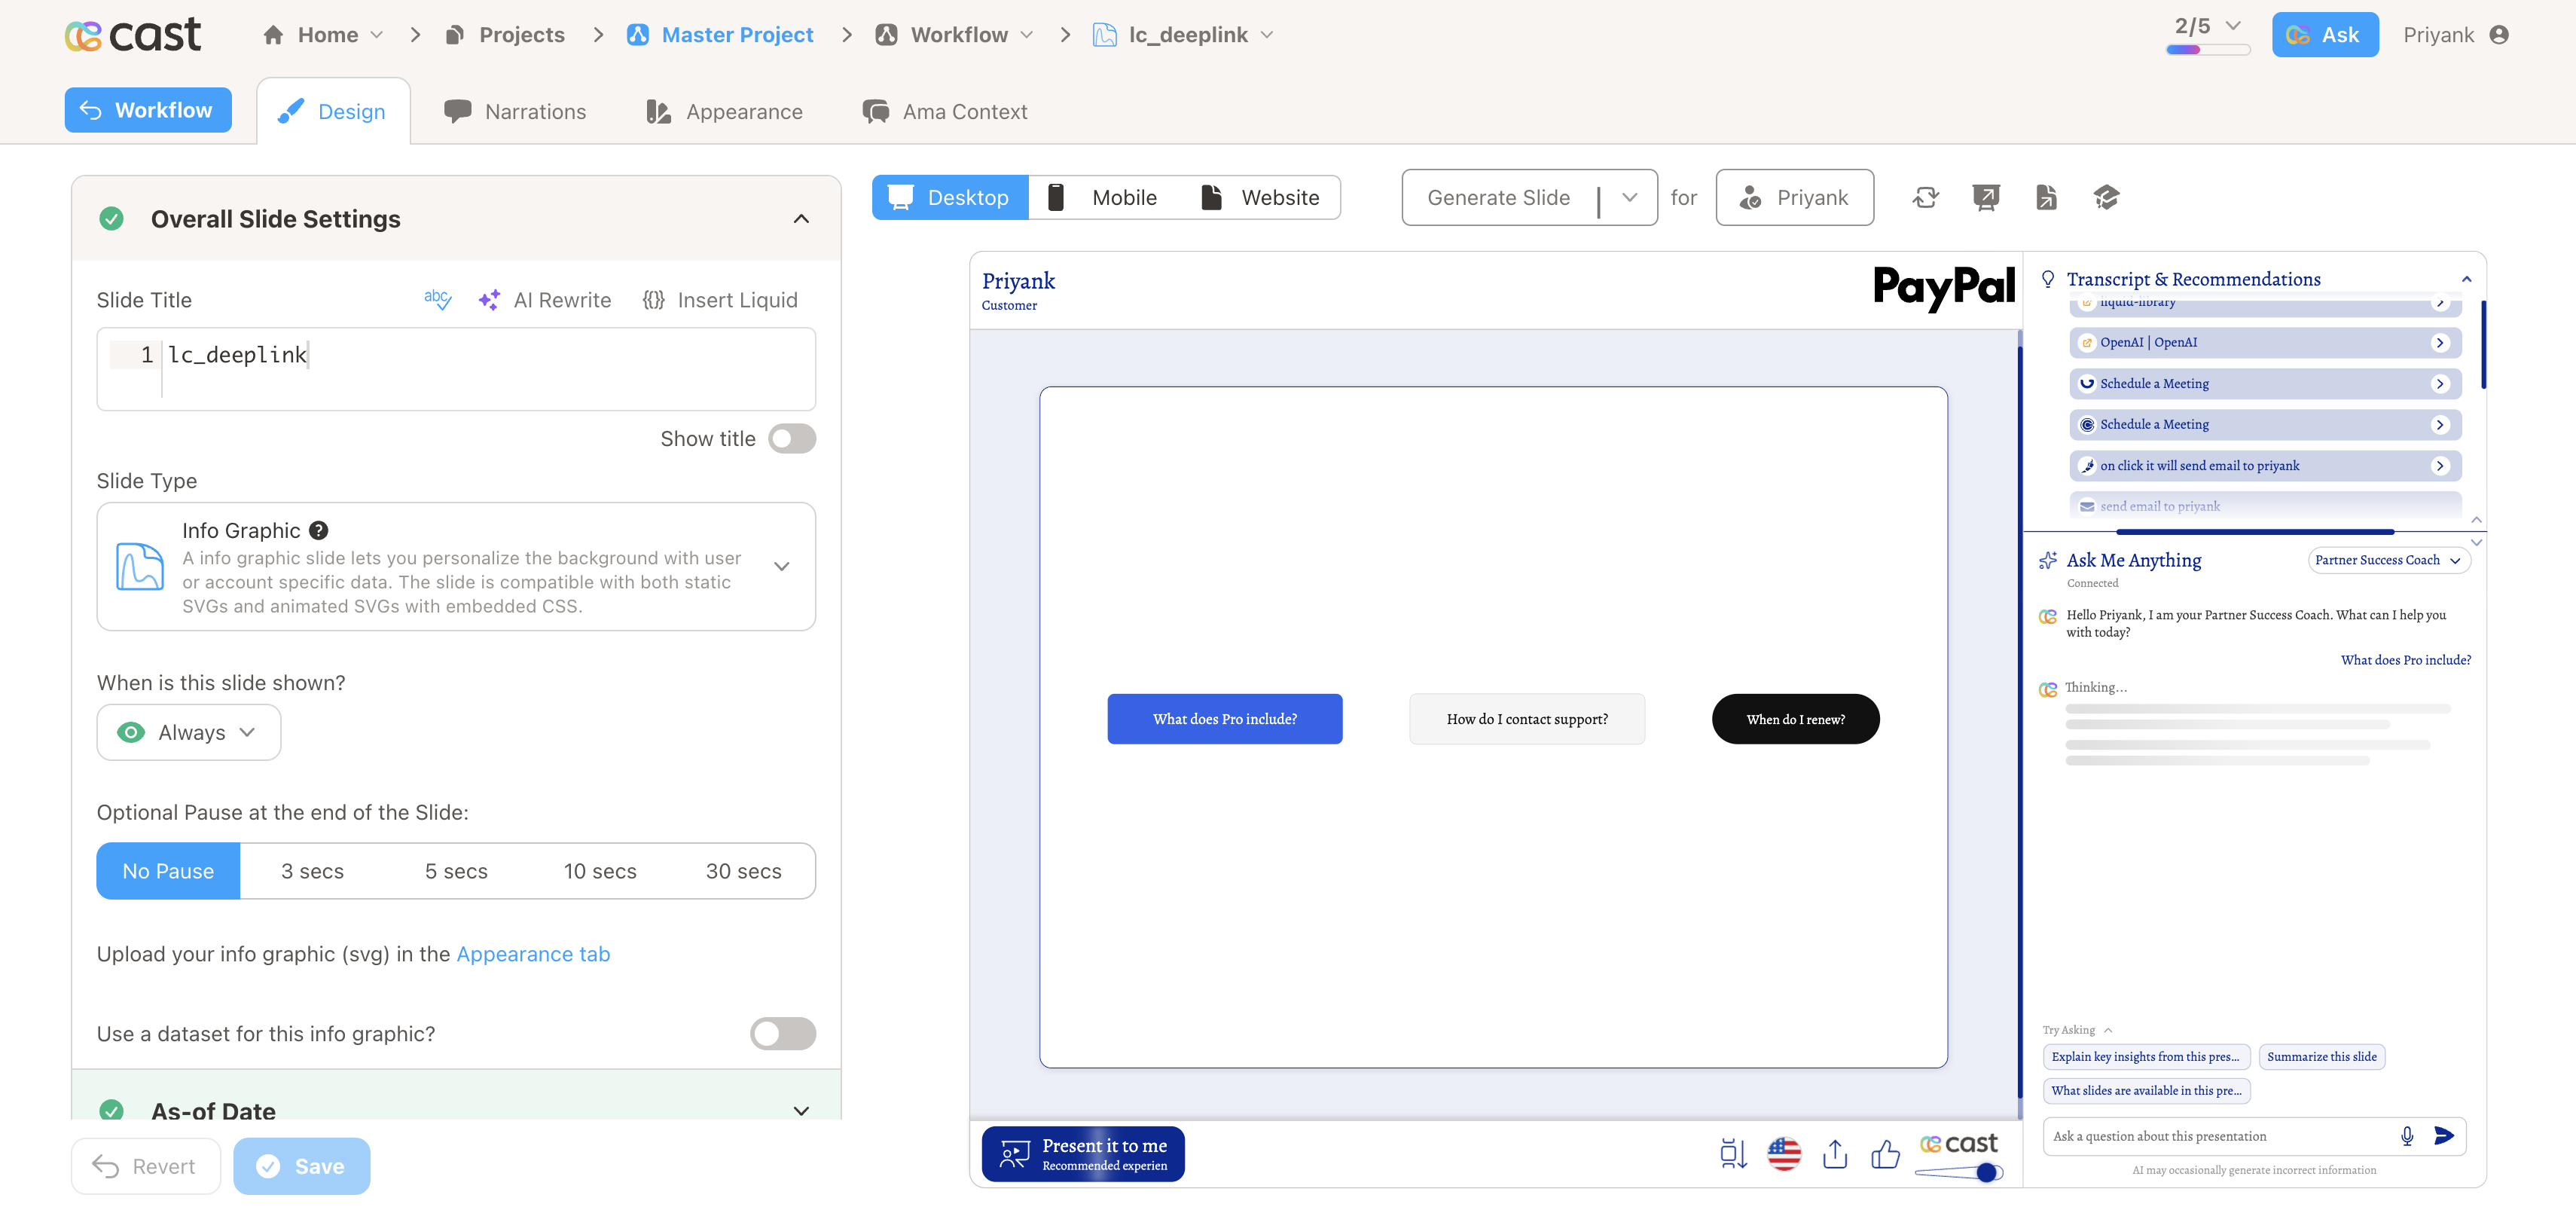 |
SVG | |
| lc_doughnut | Segmented proportional data (e.g. market share, NPS). | 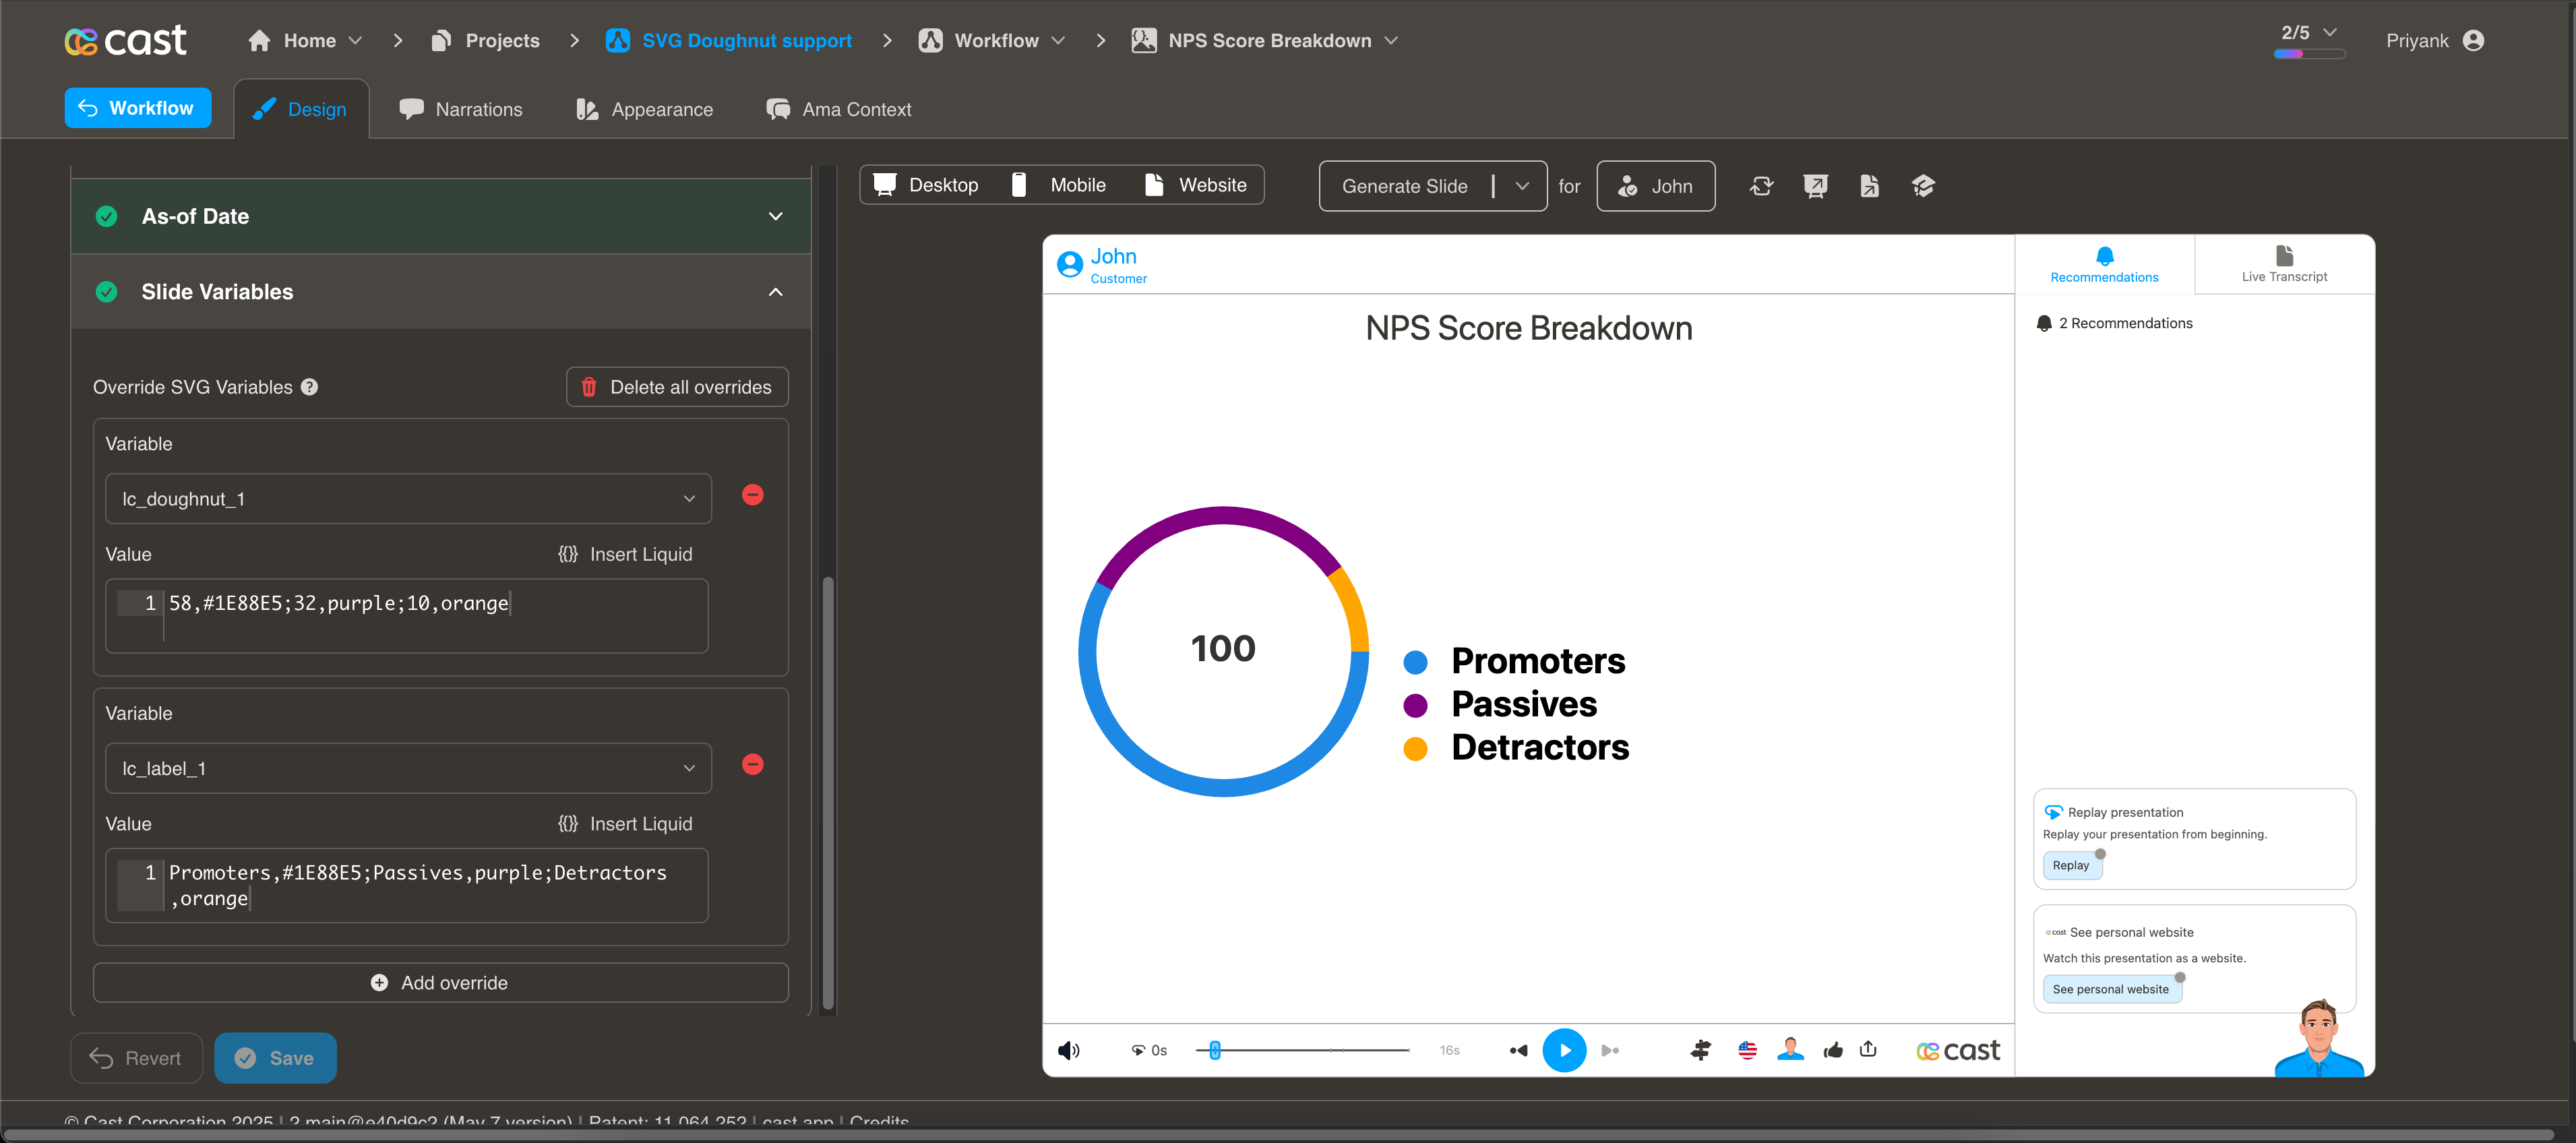 |
SVG | |
| lc_fadetext | Text with fade at the end to indicate overflow. | 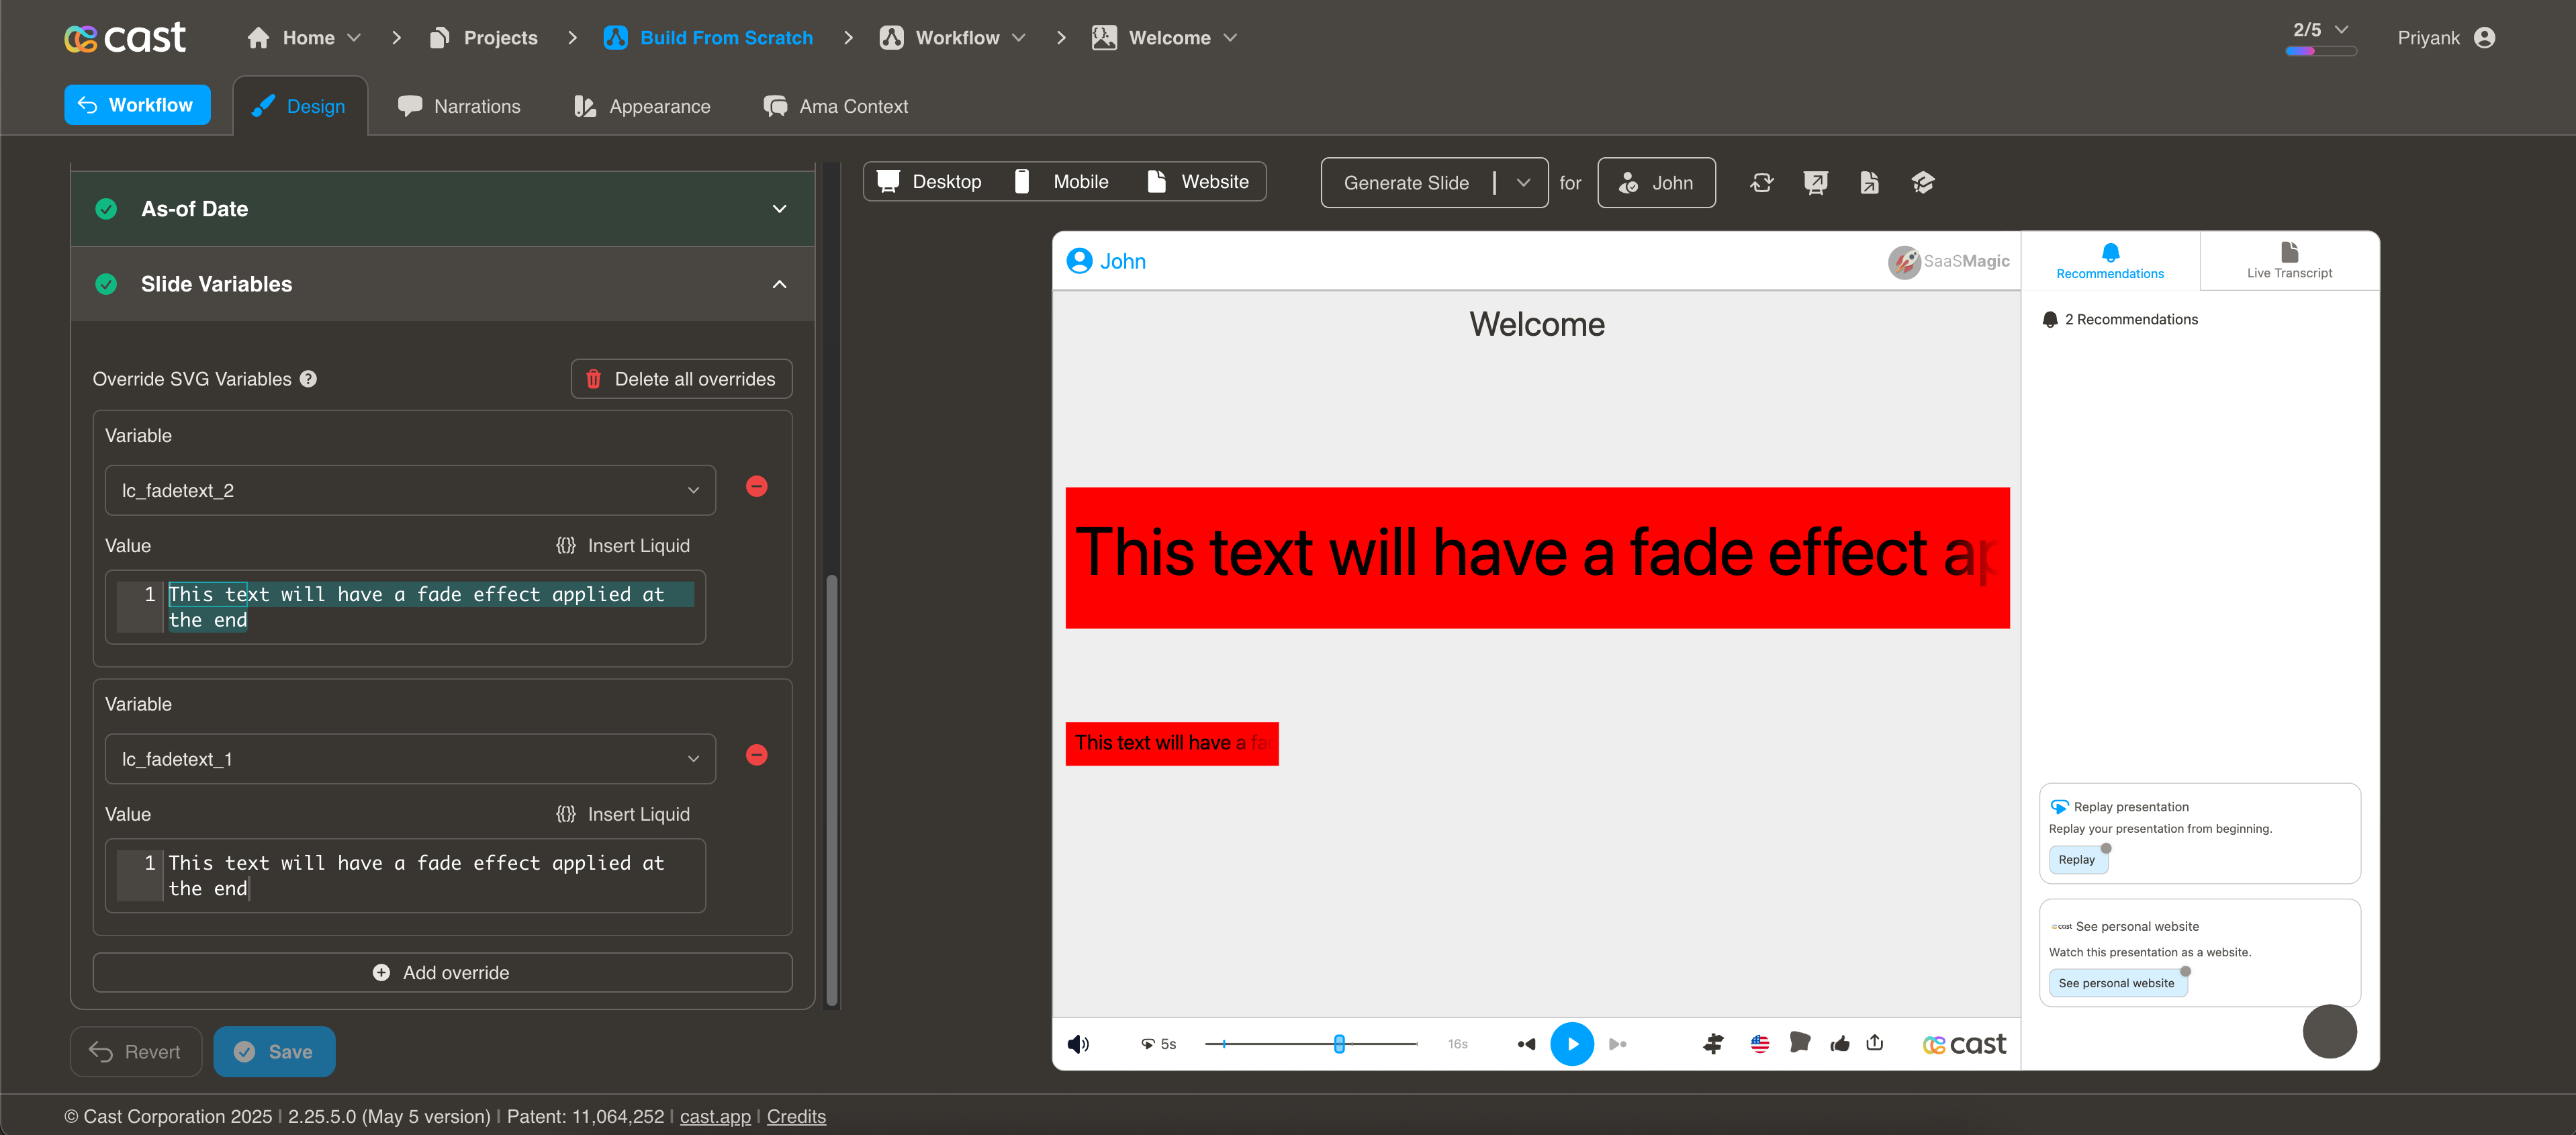 |
SVG | |
| lc_funnel_bars | Concentric bars (largest to smallest) for hierarchy. | 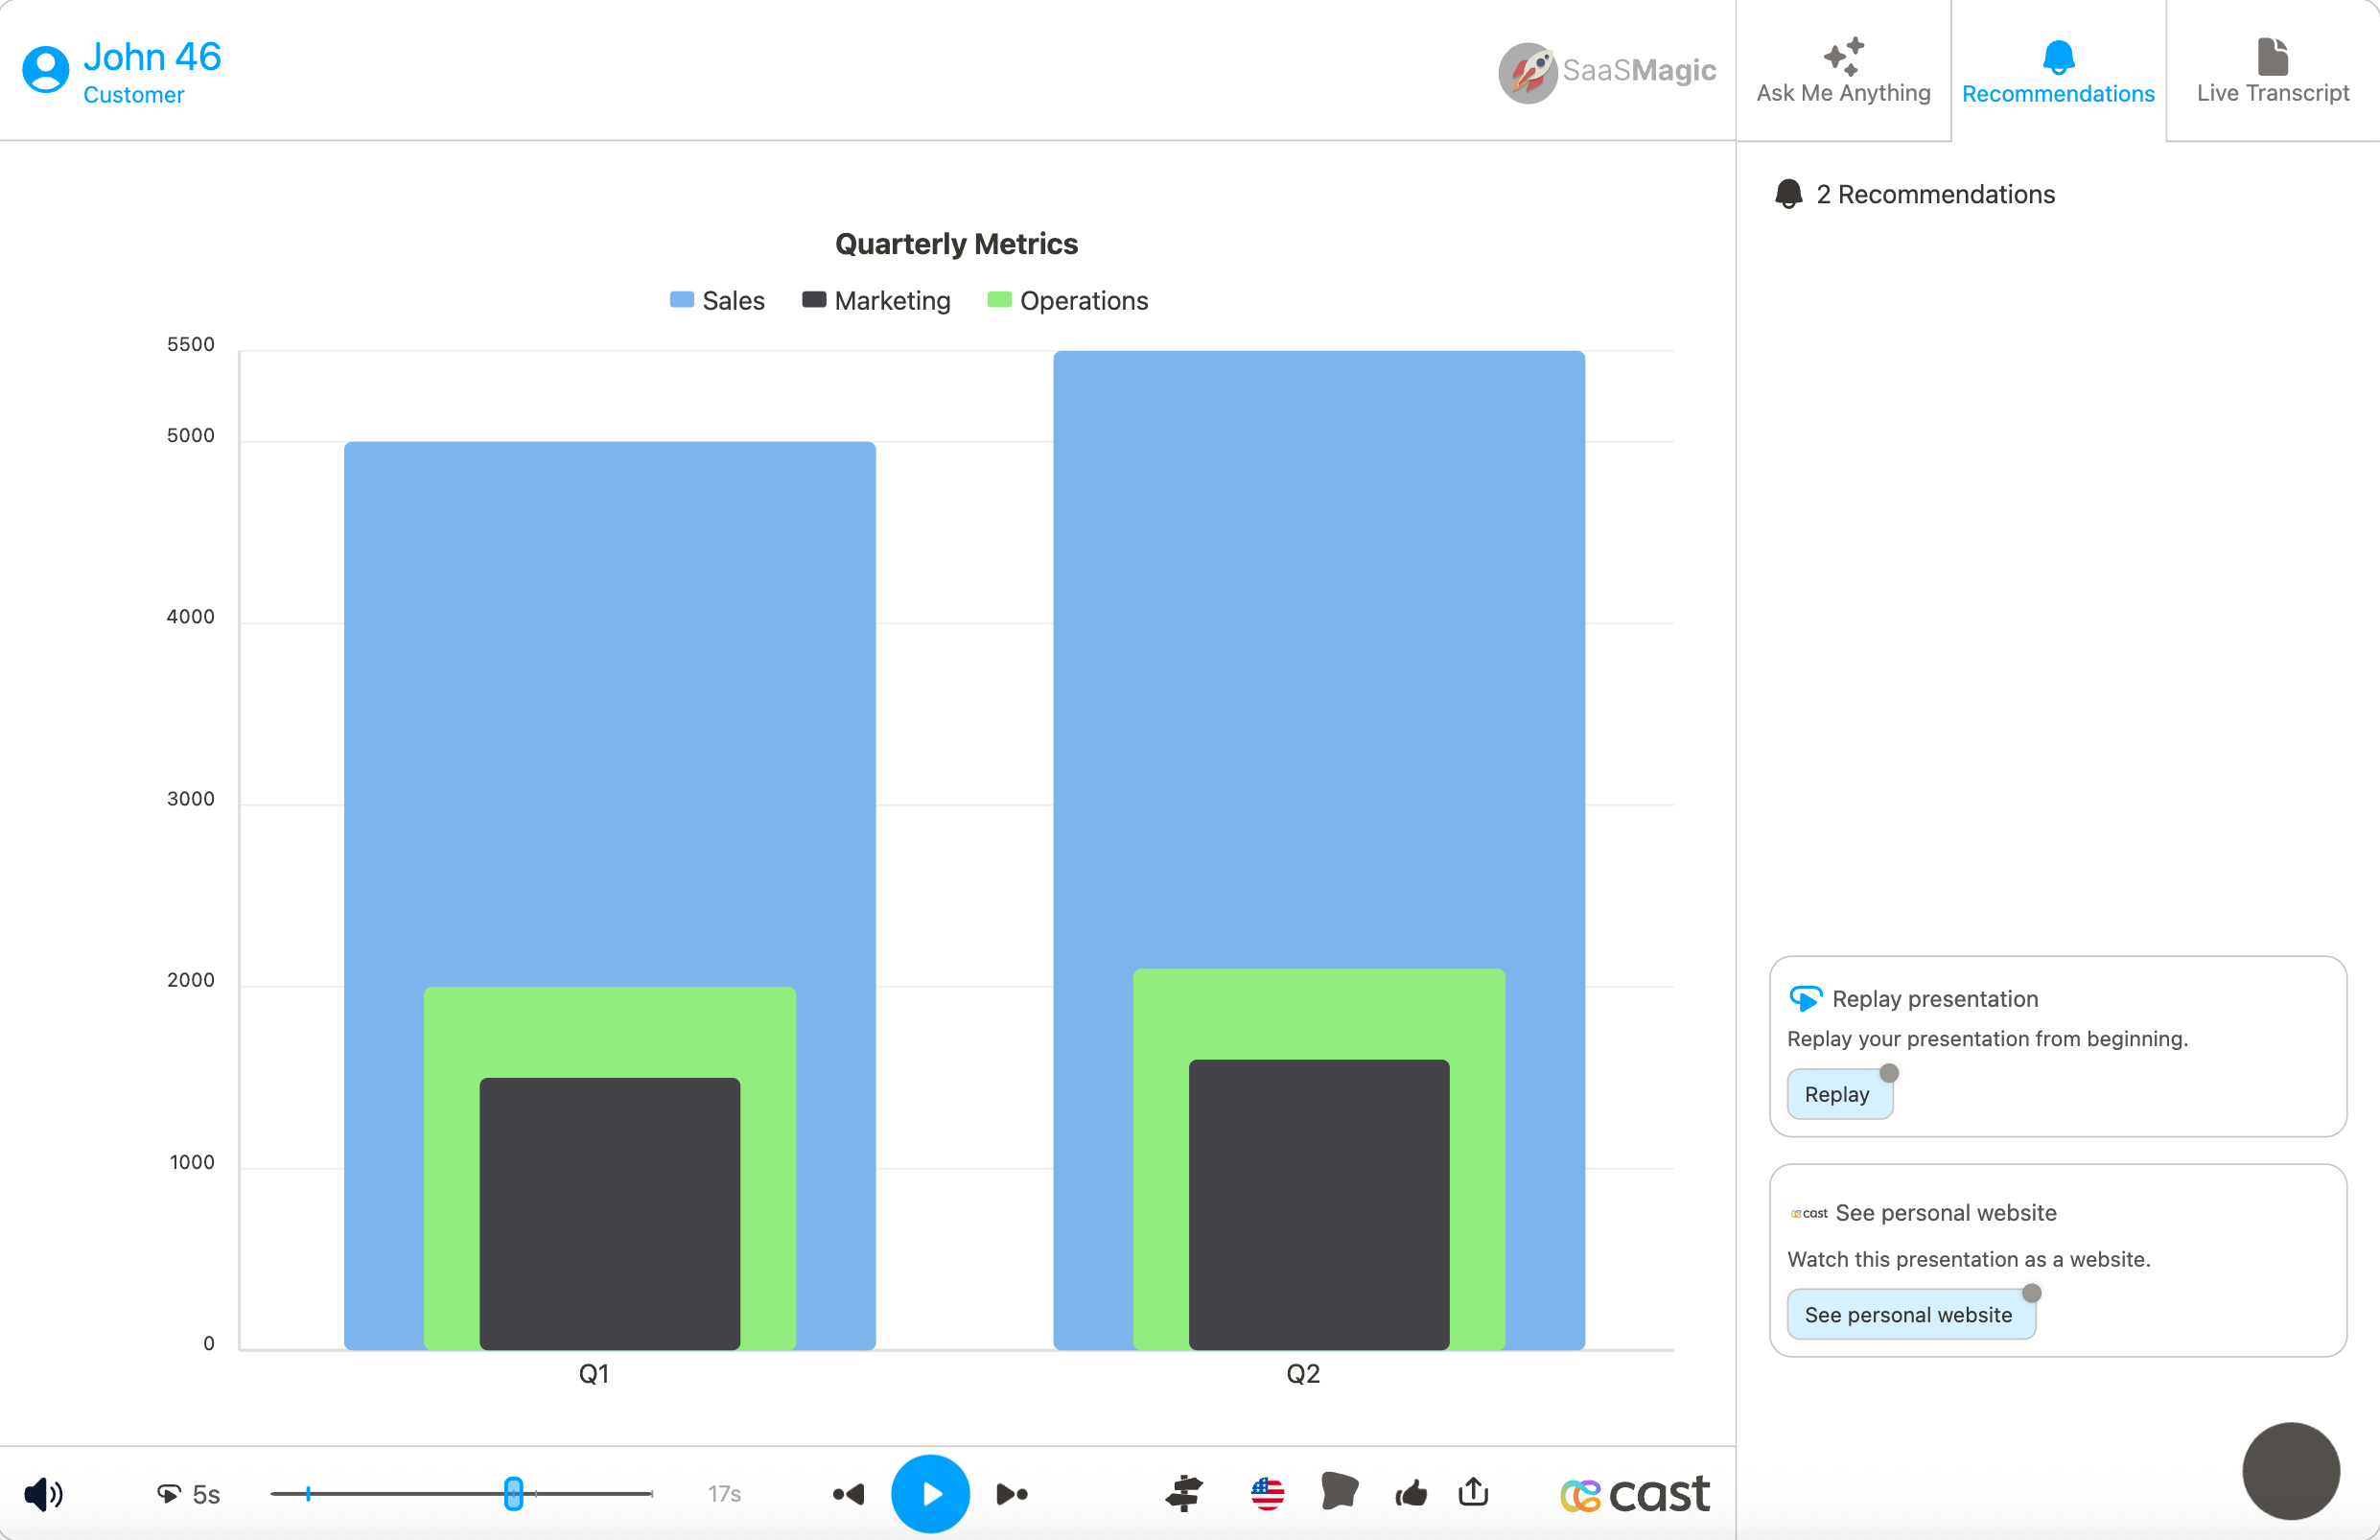 |
SVG | |
| lc_funnel_or_hannoi | Funnel or Hannoi charts (conversion funnels, hierarchy). | 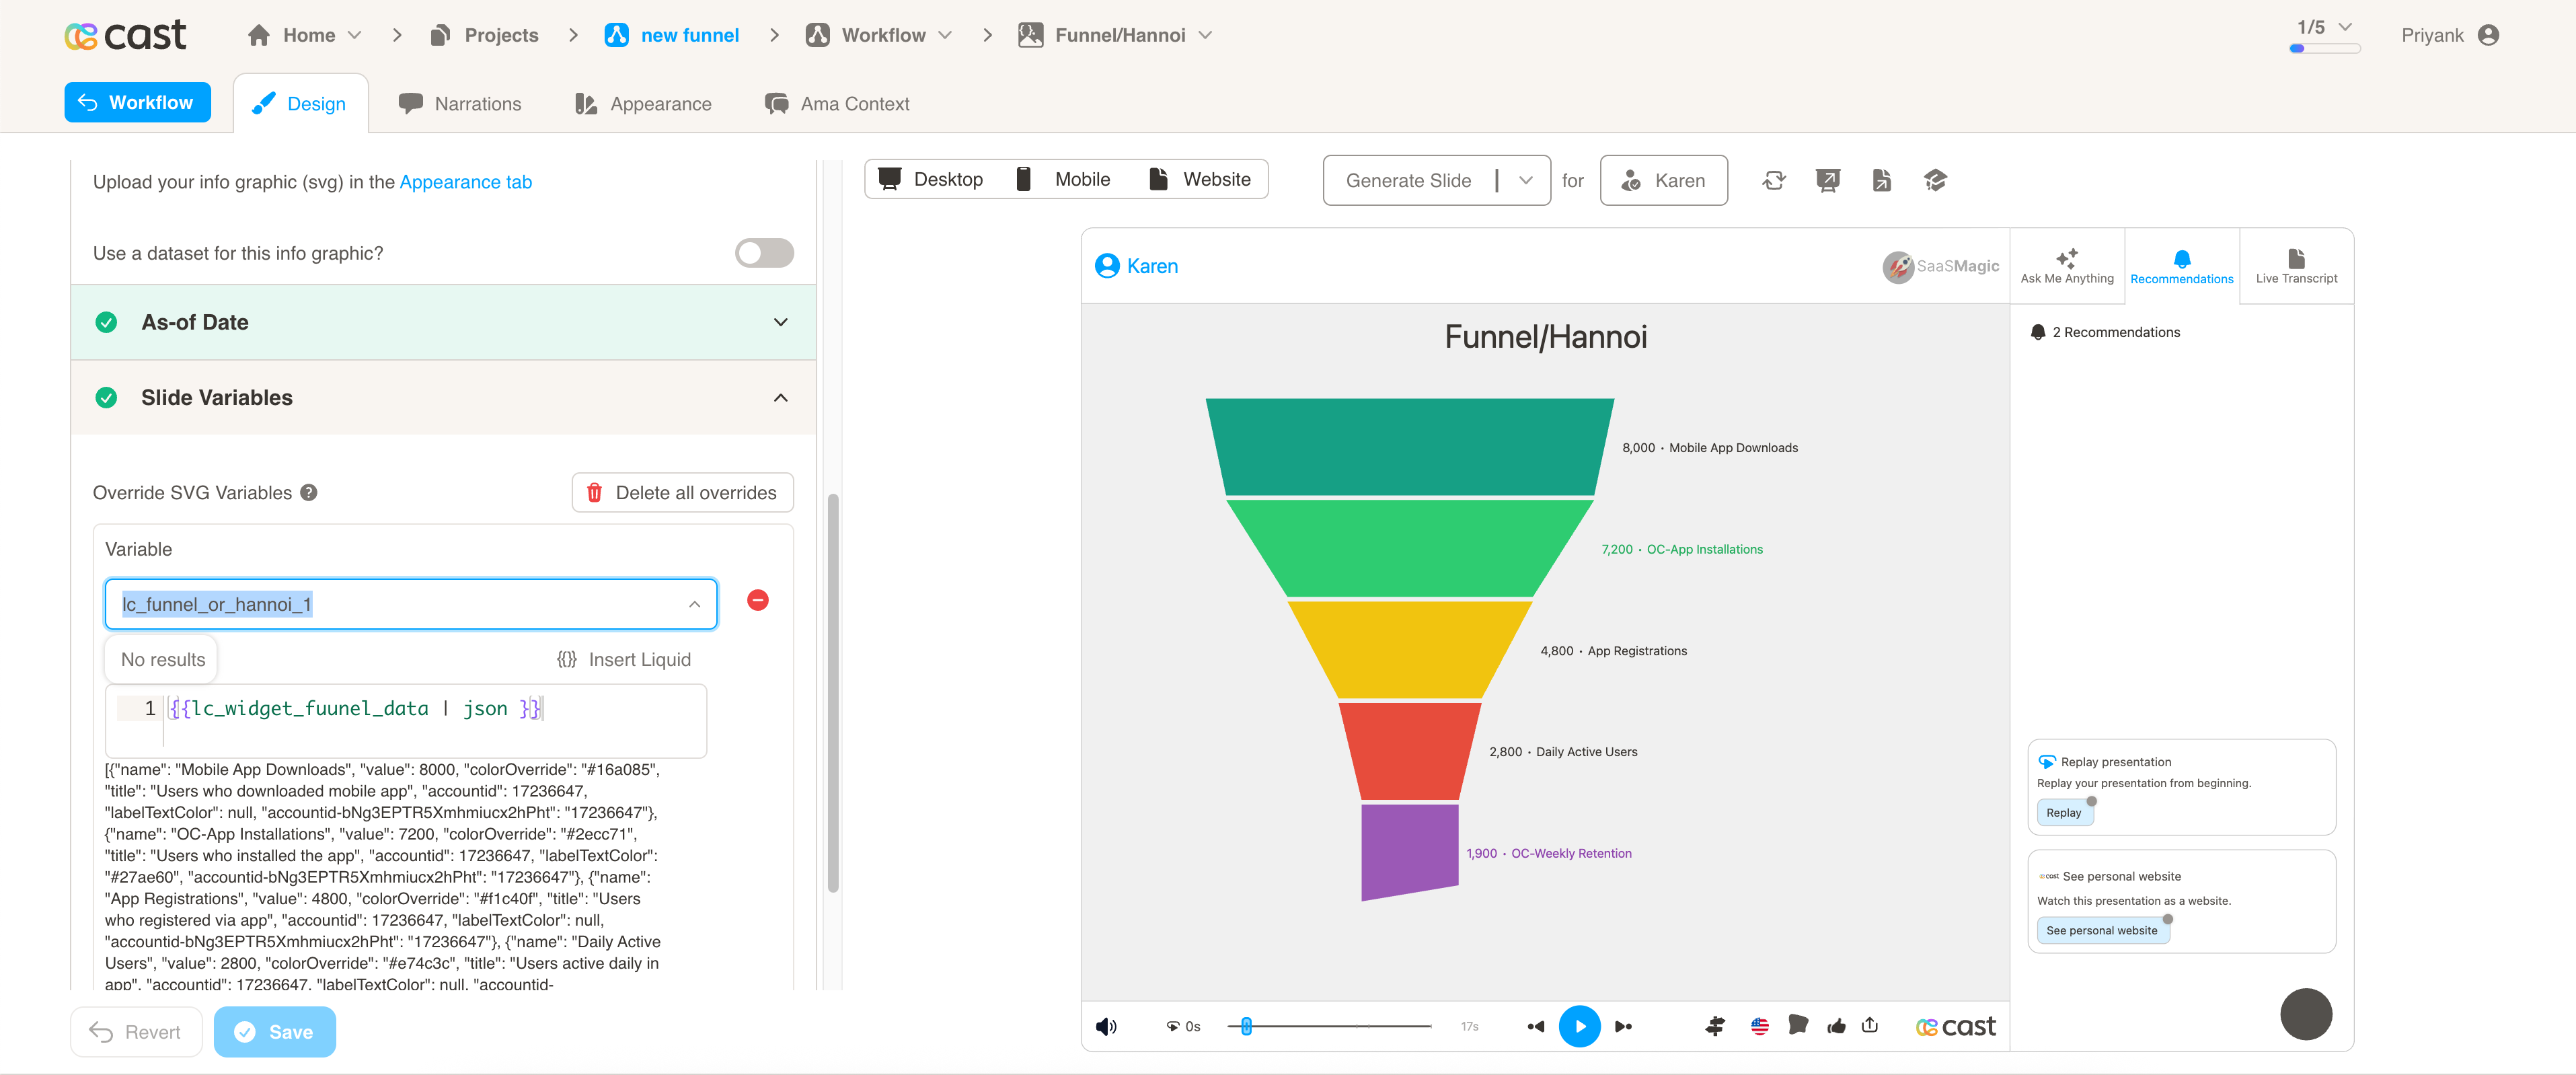 |
SVG | |
| lc_glass | Standalone frosted-glass overlay region with configurable blur. | 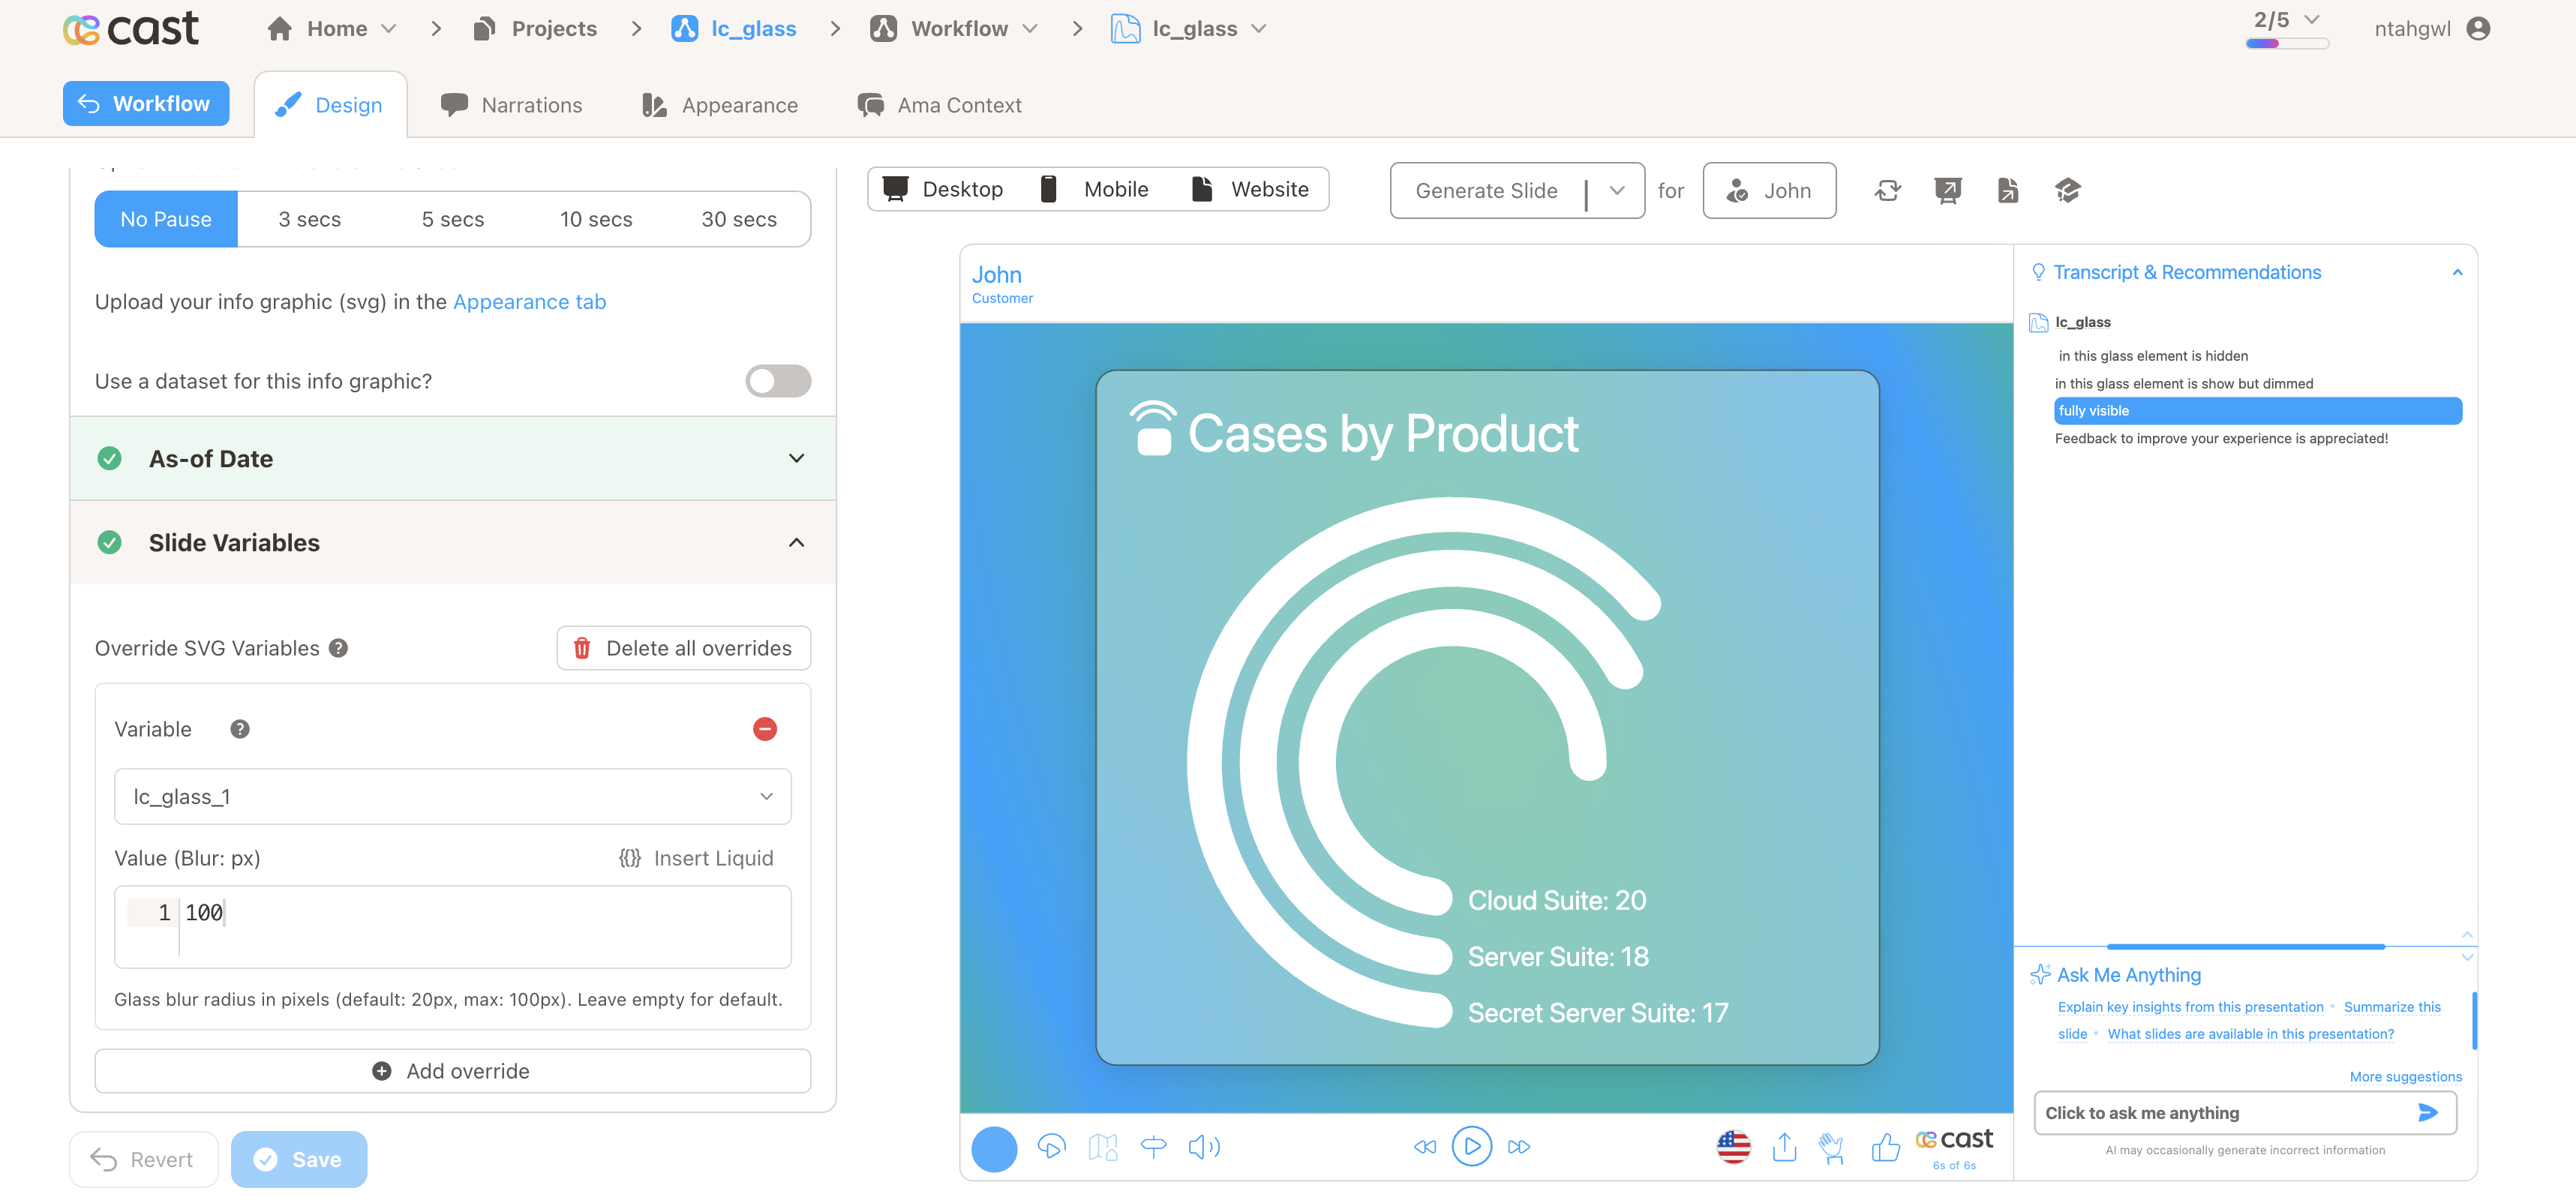 |
SVG | |
| lc_heatmap | Data intensity via color opacity (0–100). | 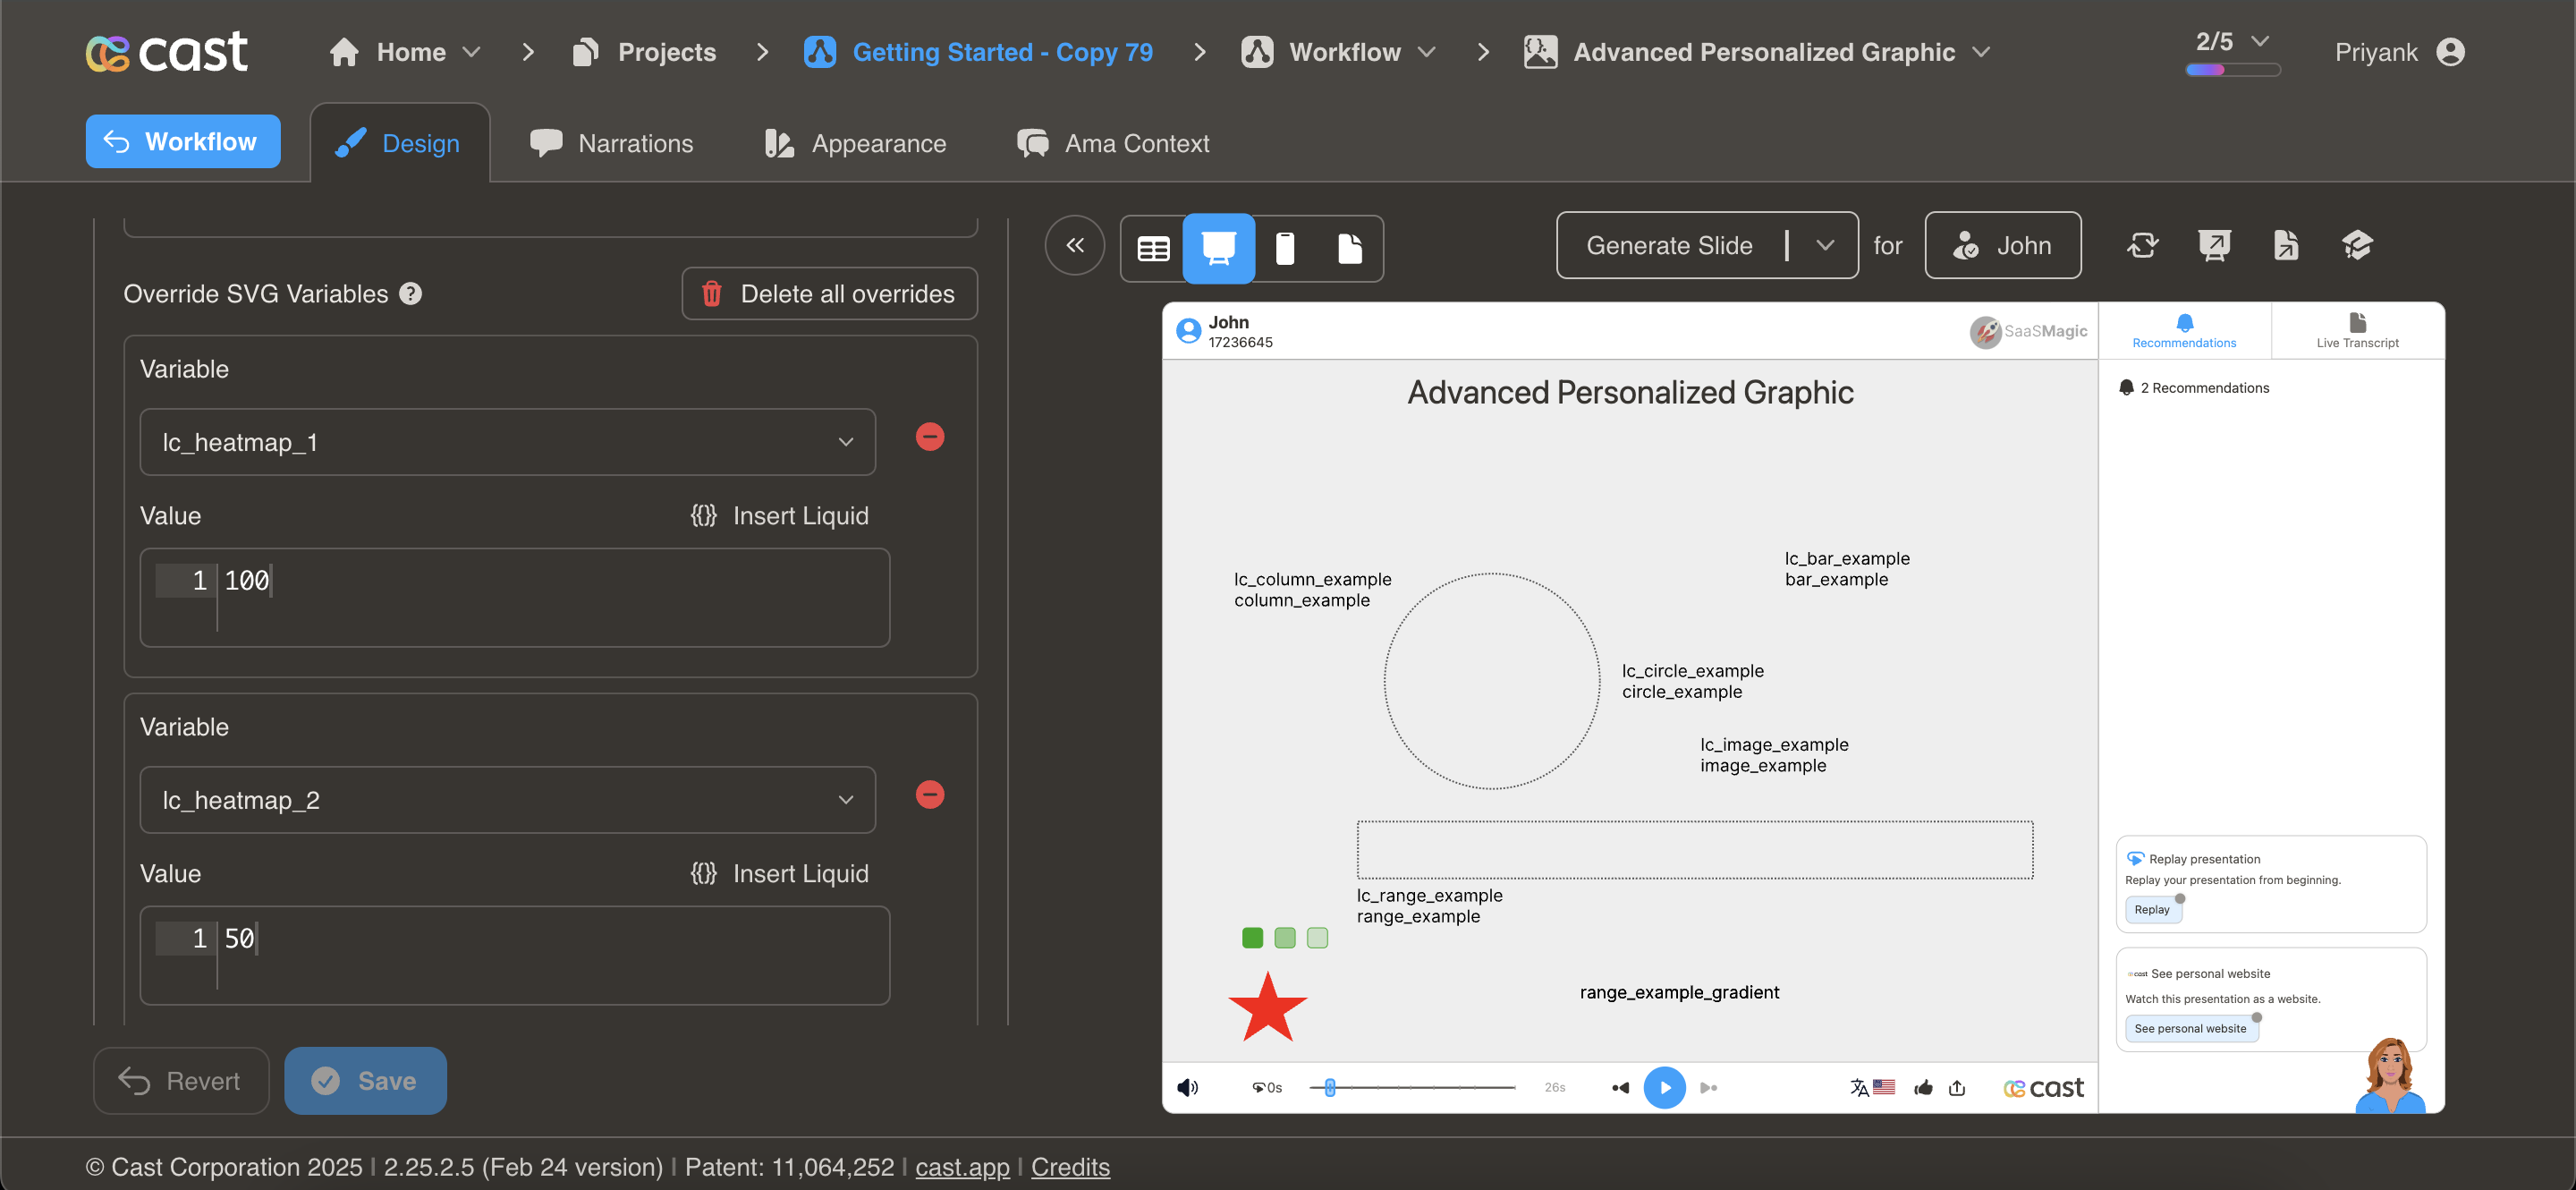 |
SVG | |
| lc_html_content | Richly formatted text (bold, color, multiple languages) beyond what a plain text variable can do. | 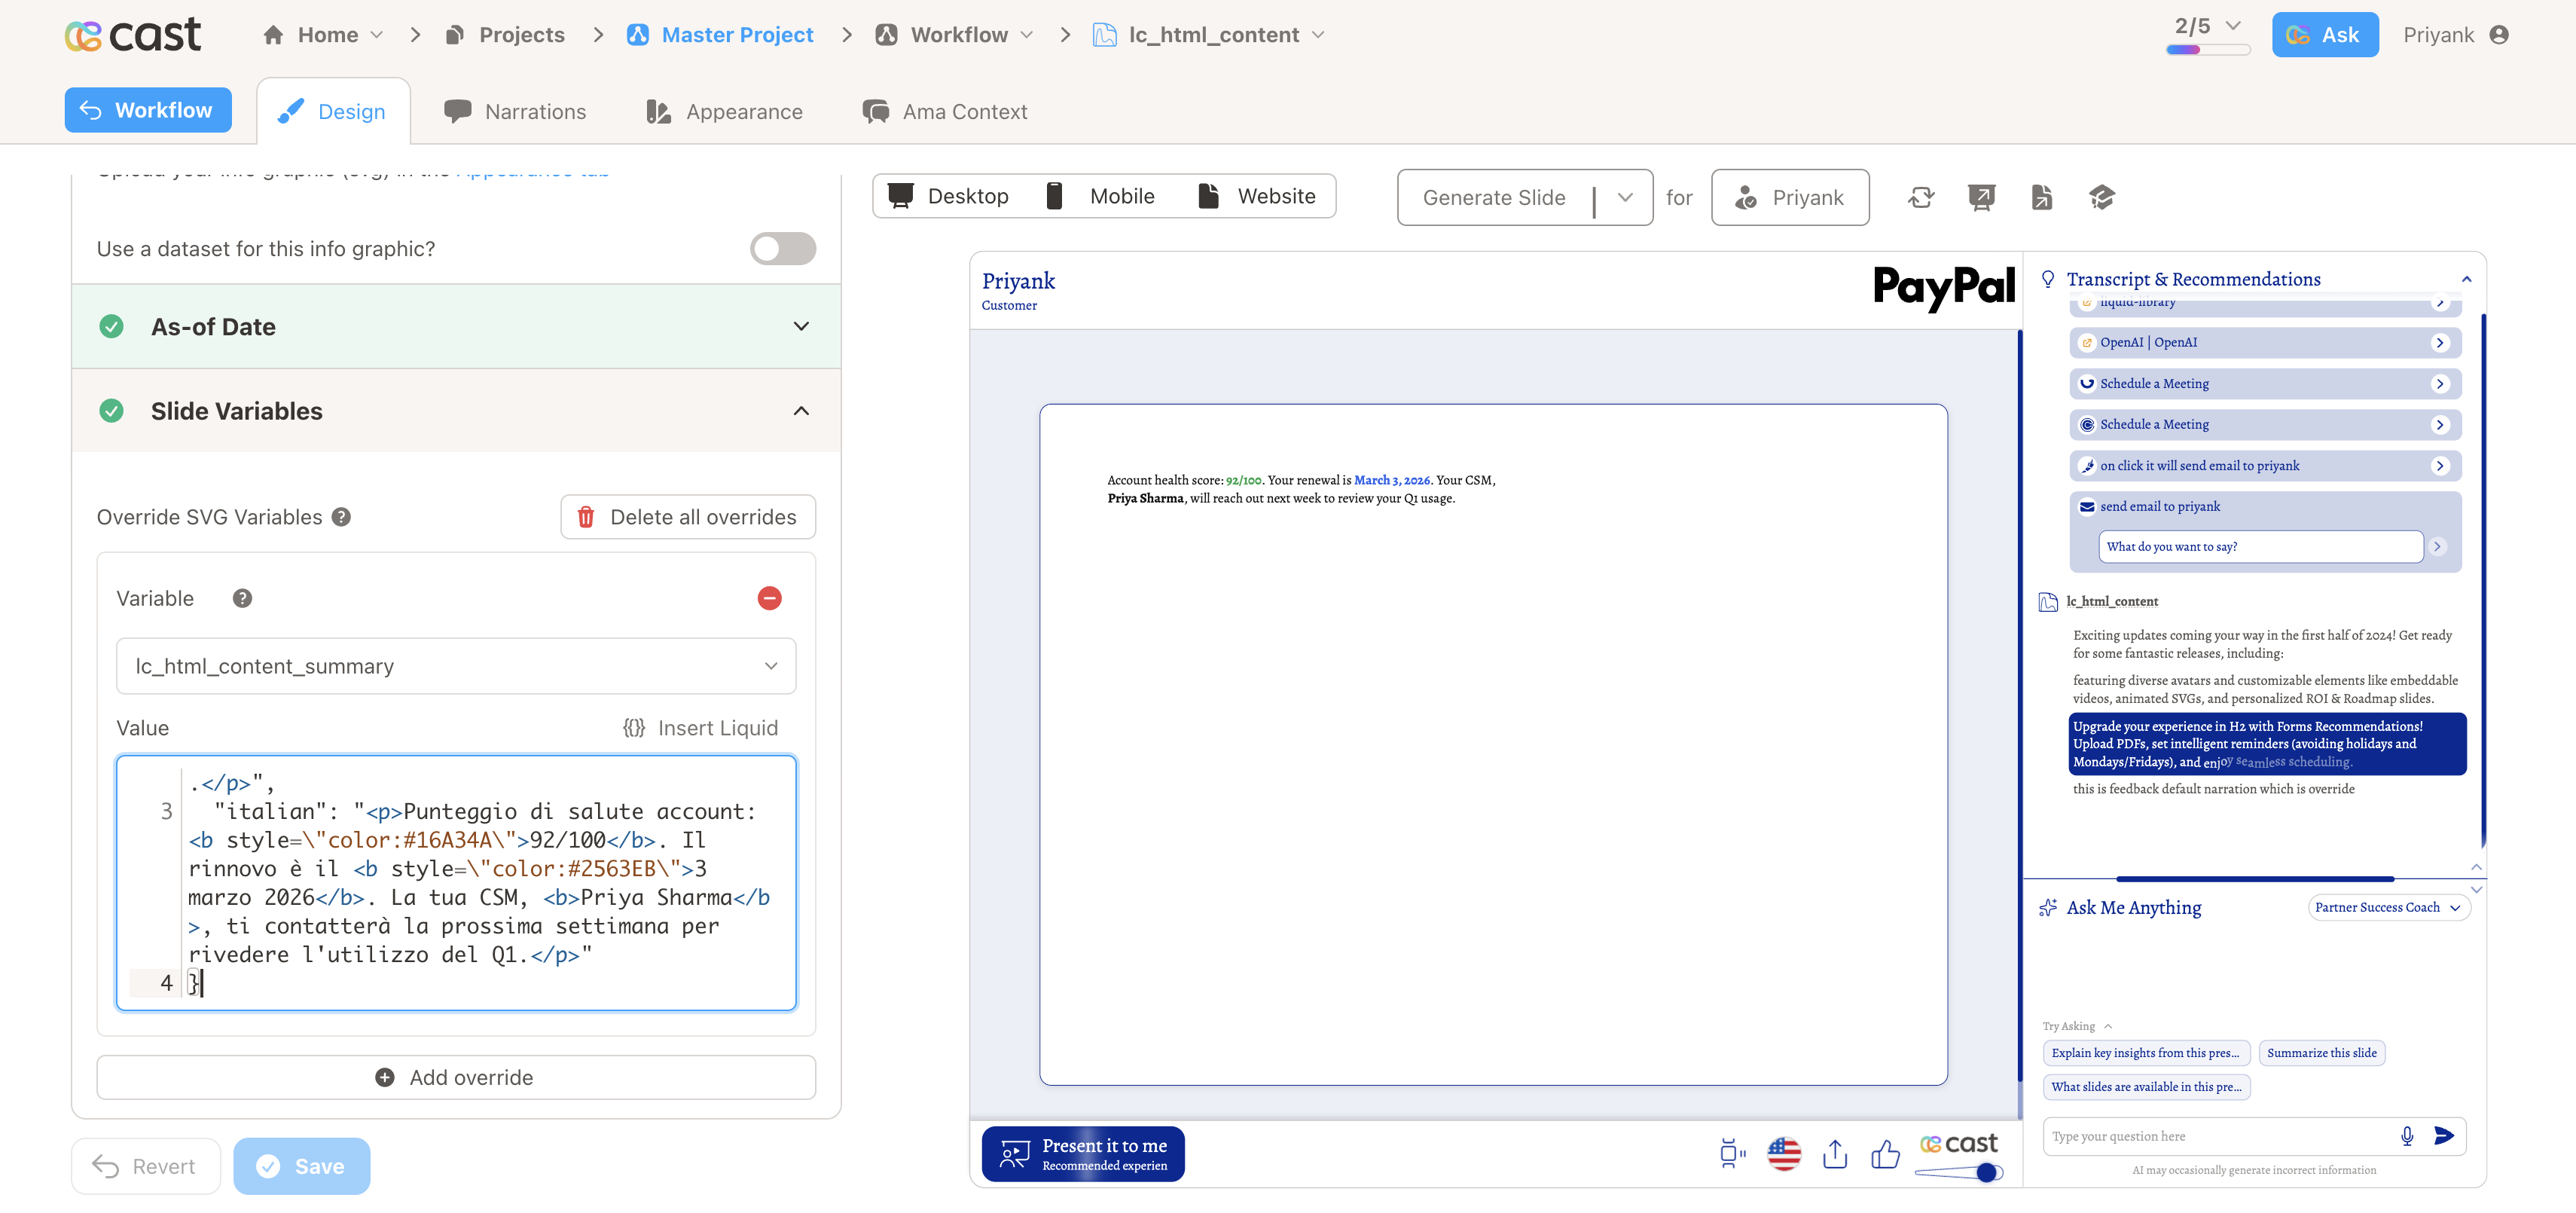 |
SVG | |
| lc_html_table | Responsive HTML table with card layouts, progress bars, and row spanning. |  |
SVG | |
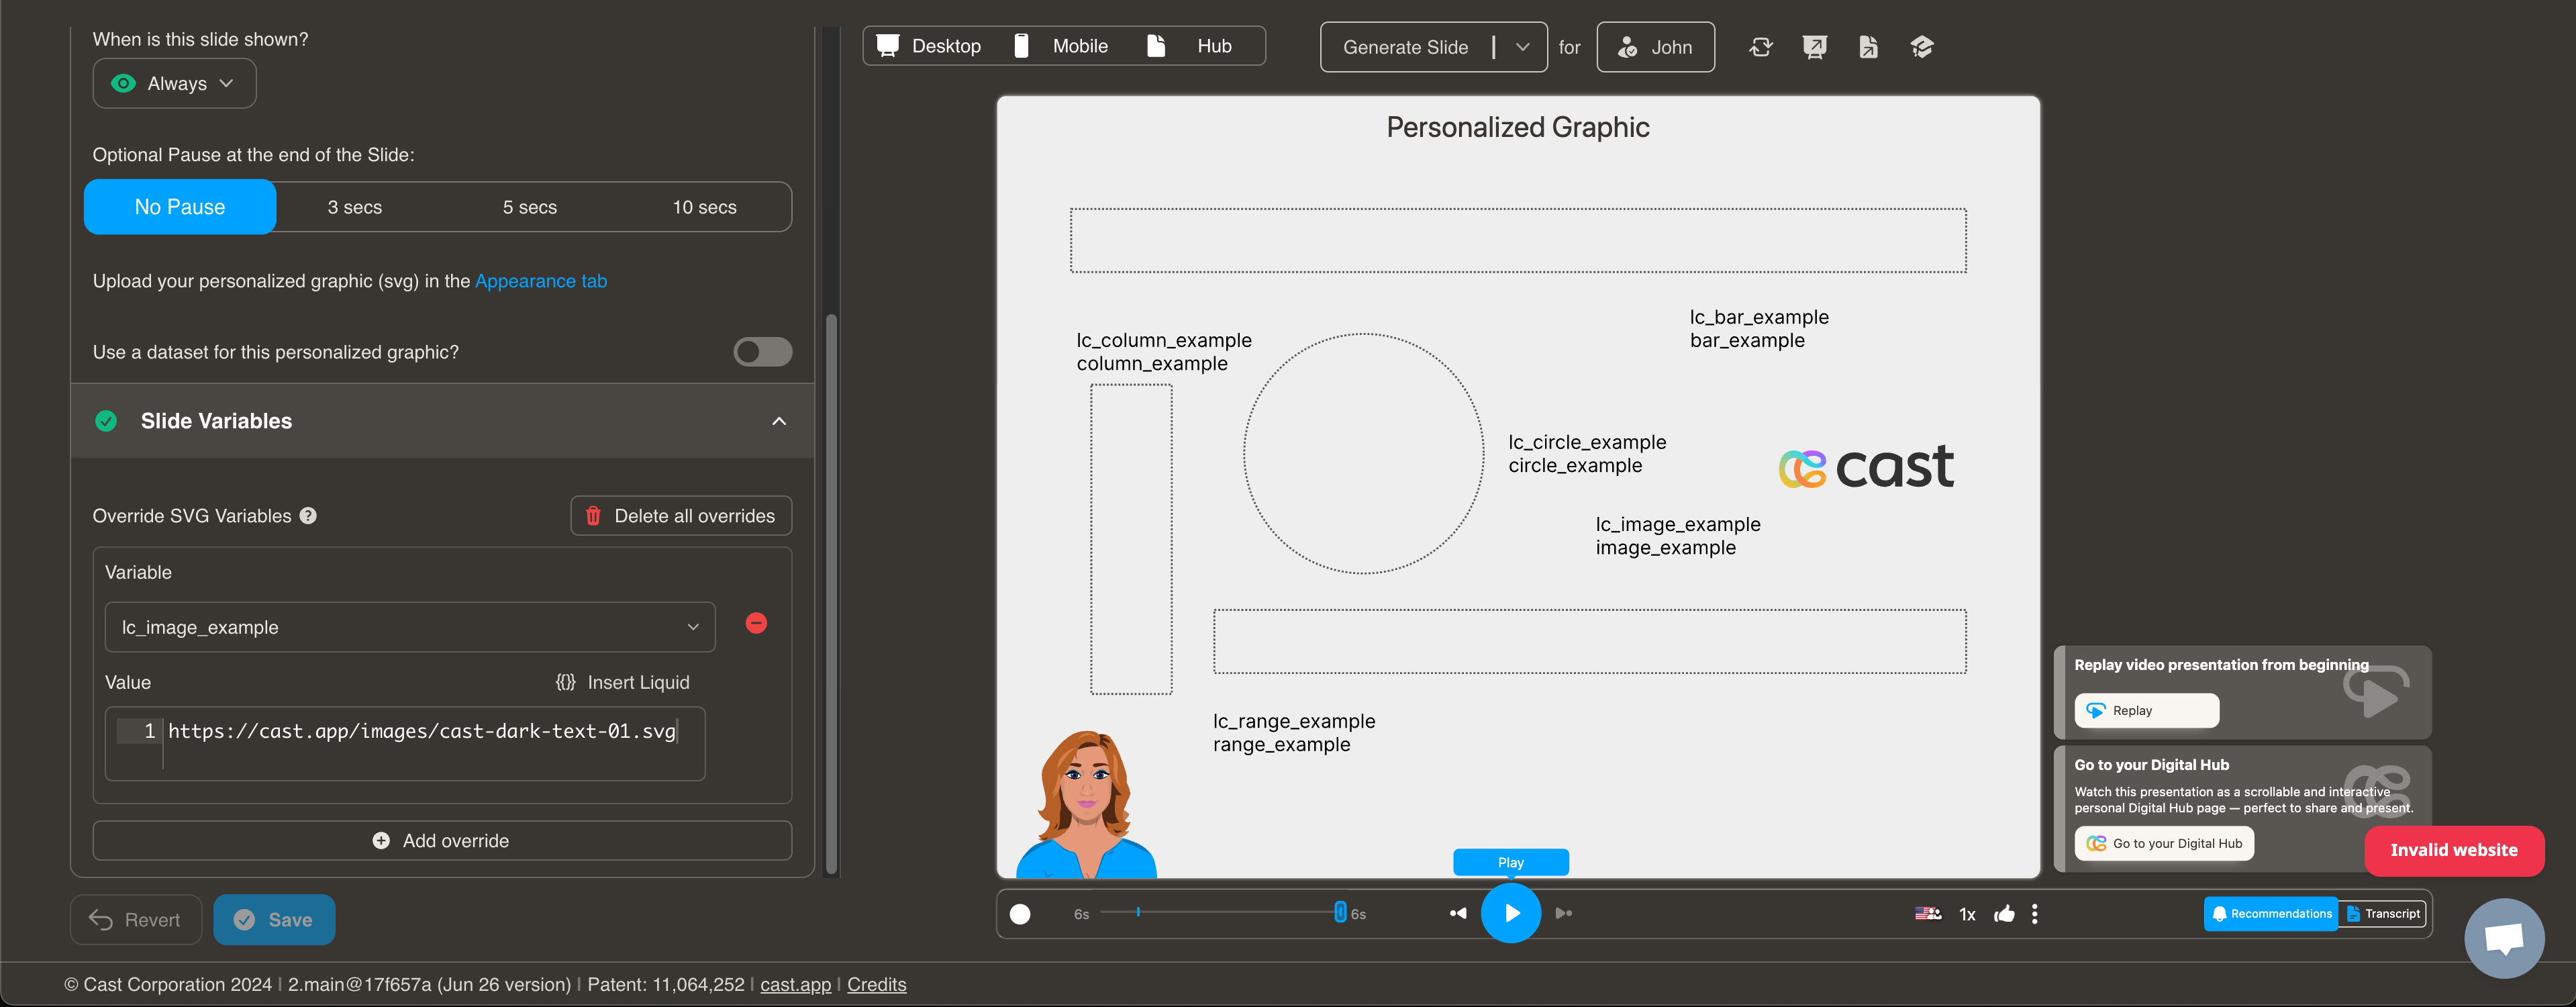
| lc_image | Dynamic images with alignment grid: left|center|right × top|middle|bottom (logos, product images, photos). |
 |
SVG | |
| lc_kenburns | Cinematic zoom and pan on any SVG element. | CSV | SVG | |
| lc_label | Labeled lists with optional colored bullets (legends). | 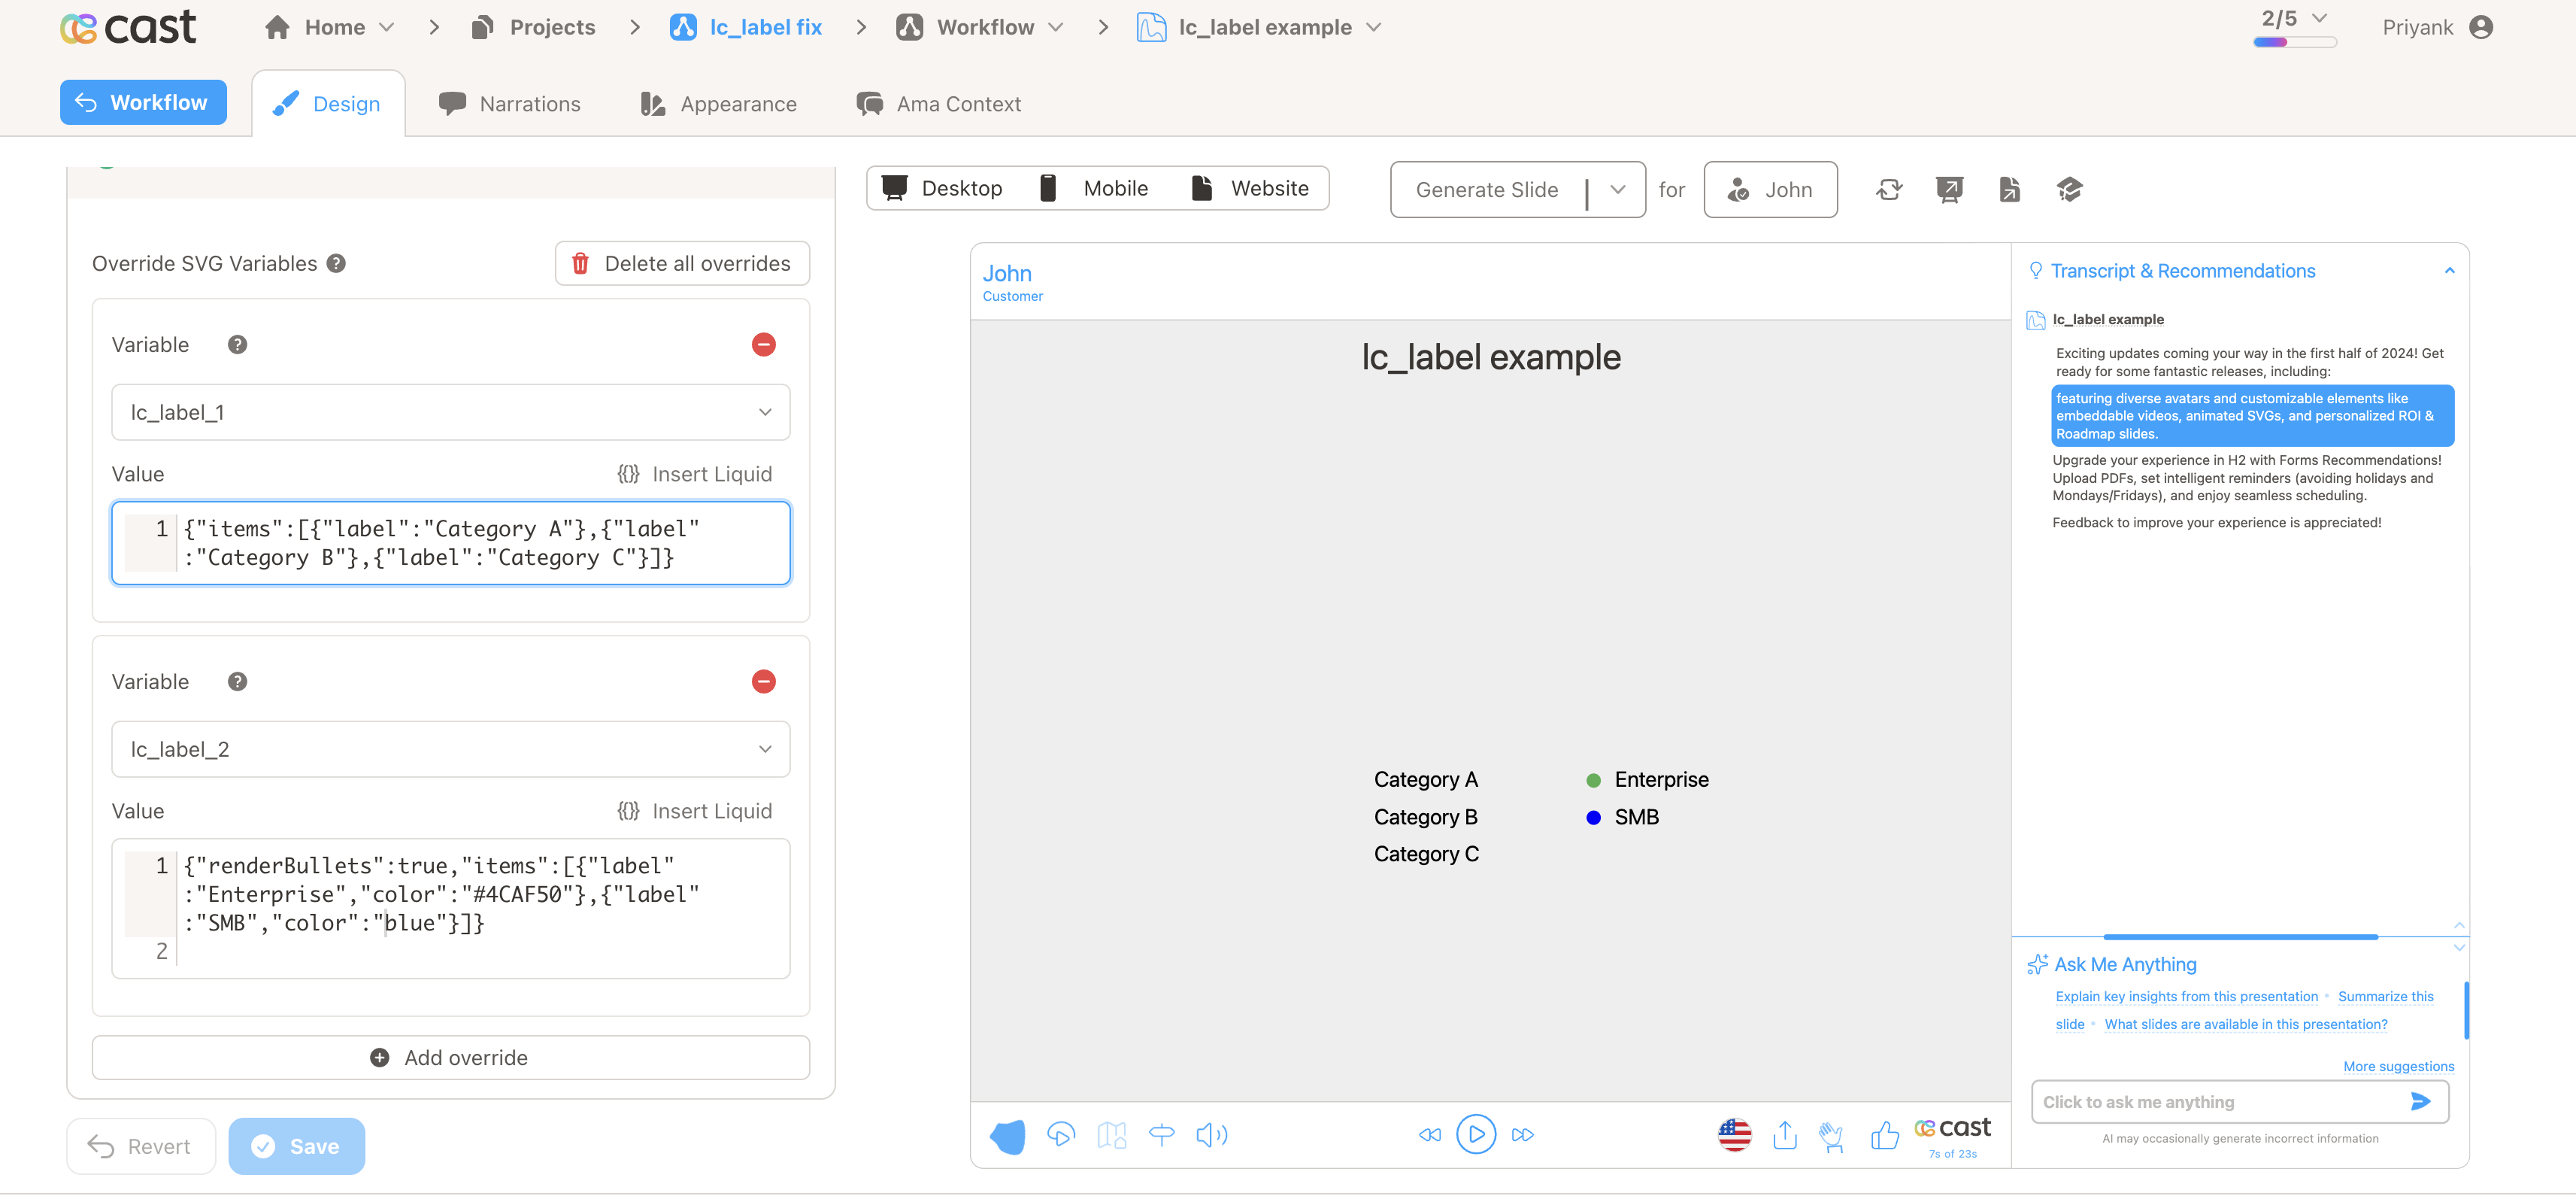 |
SVG | |
| lc_lottie | Lottie animations from JSON (logos, loaders, illustrations). | CSV | SVG | |
| lc_multiple_bars | Side-by-side bars within each category (comparison). | 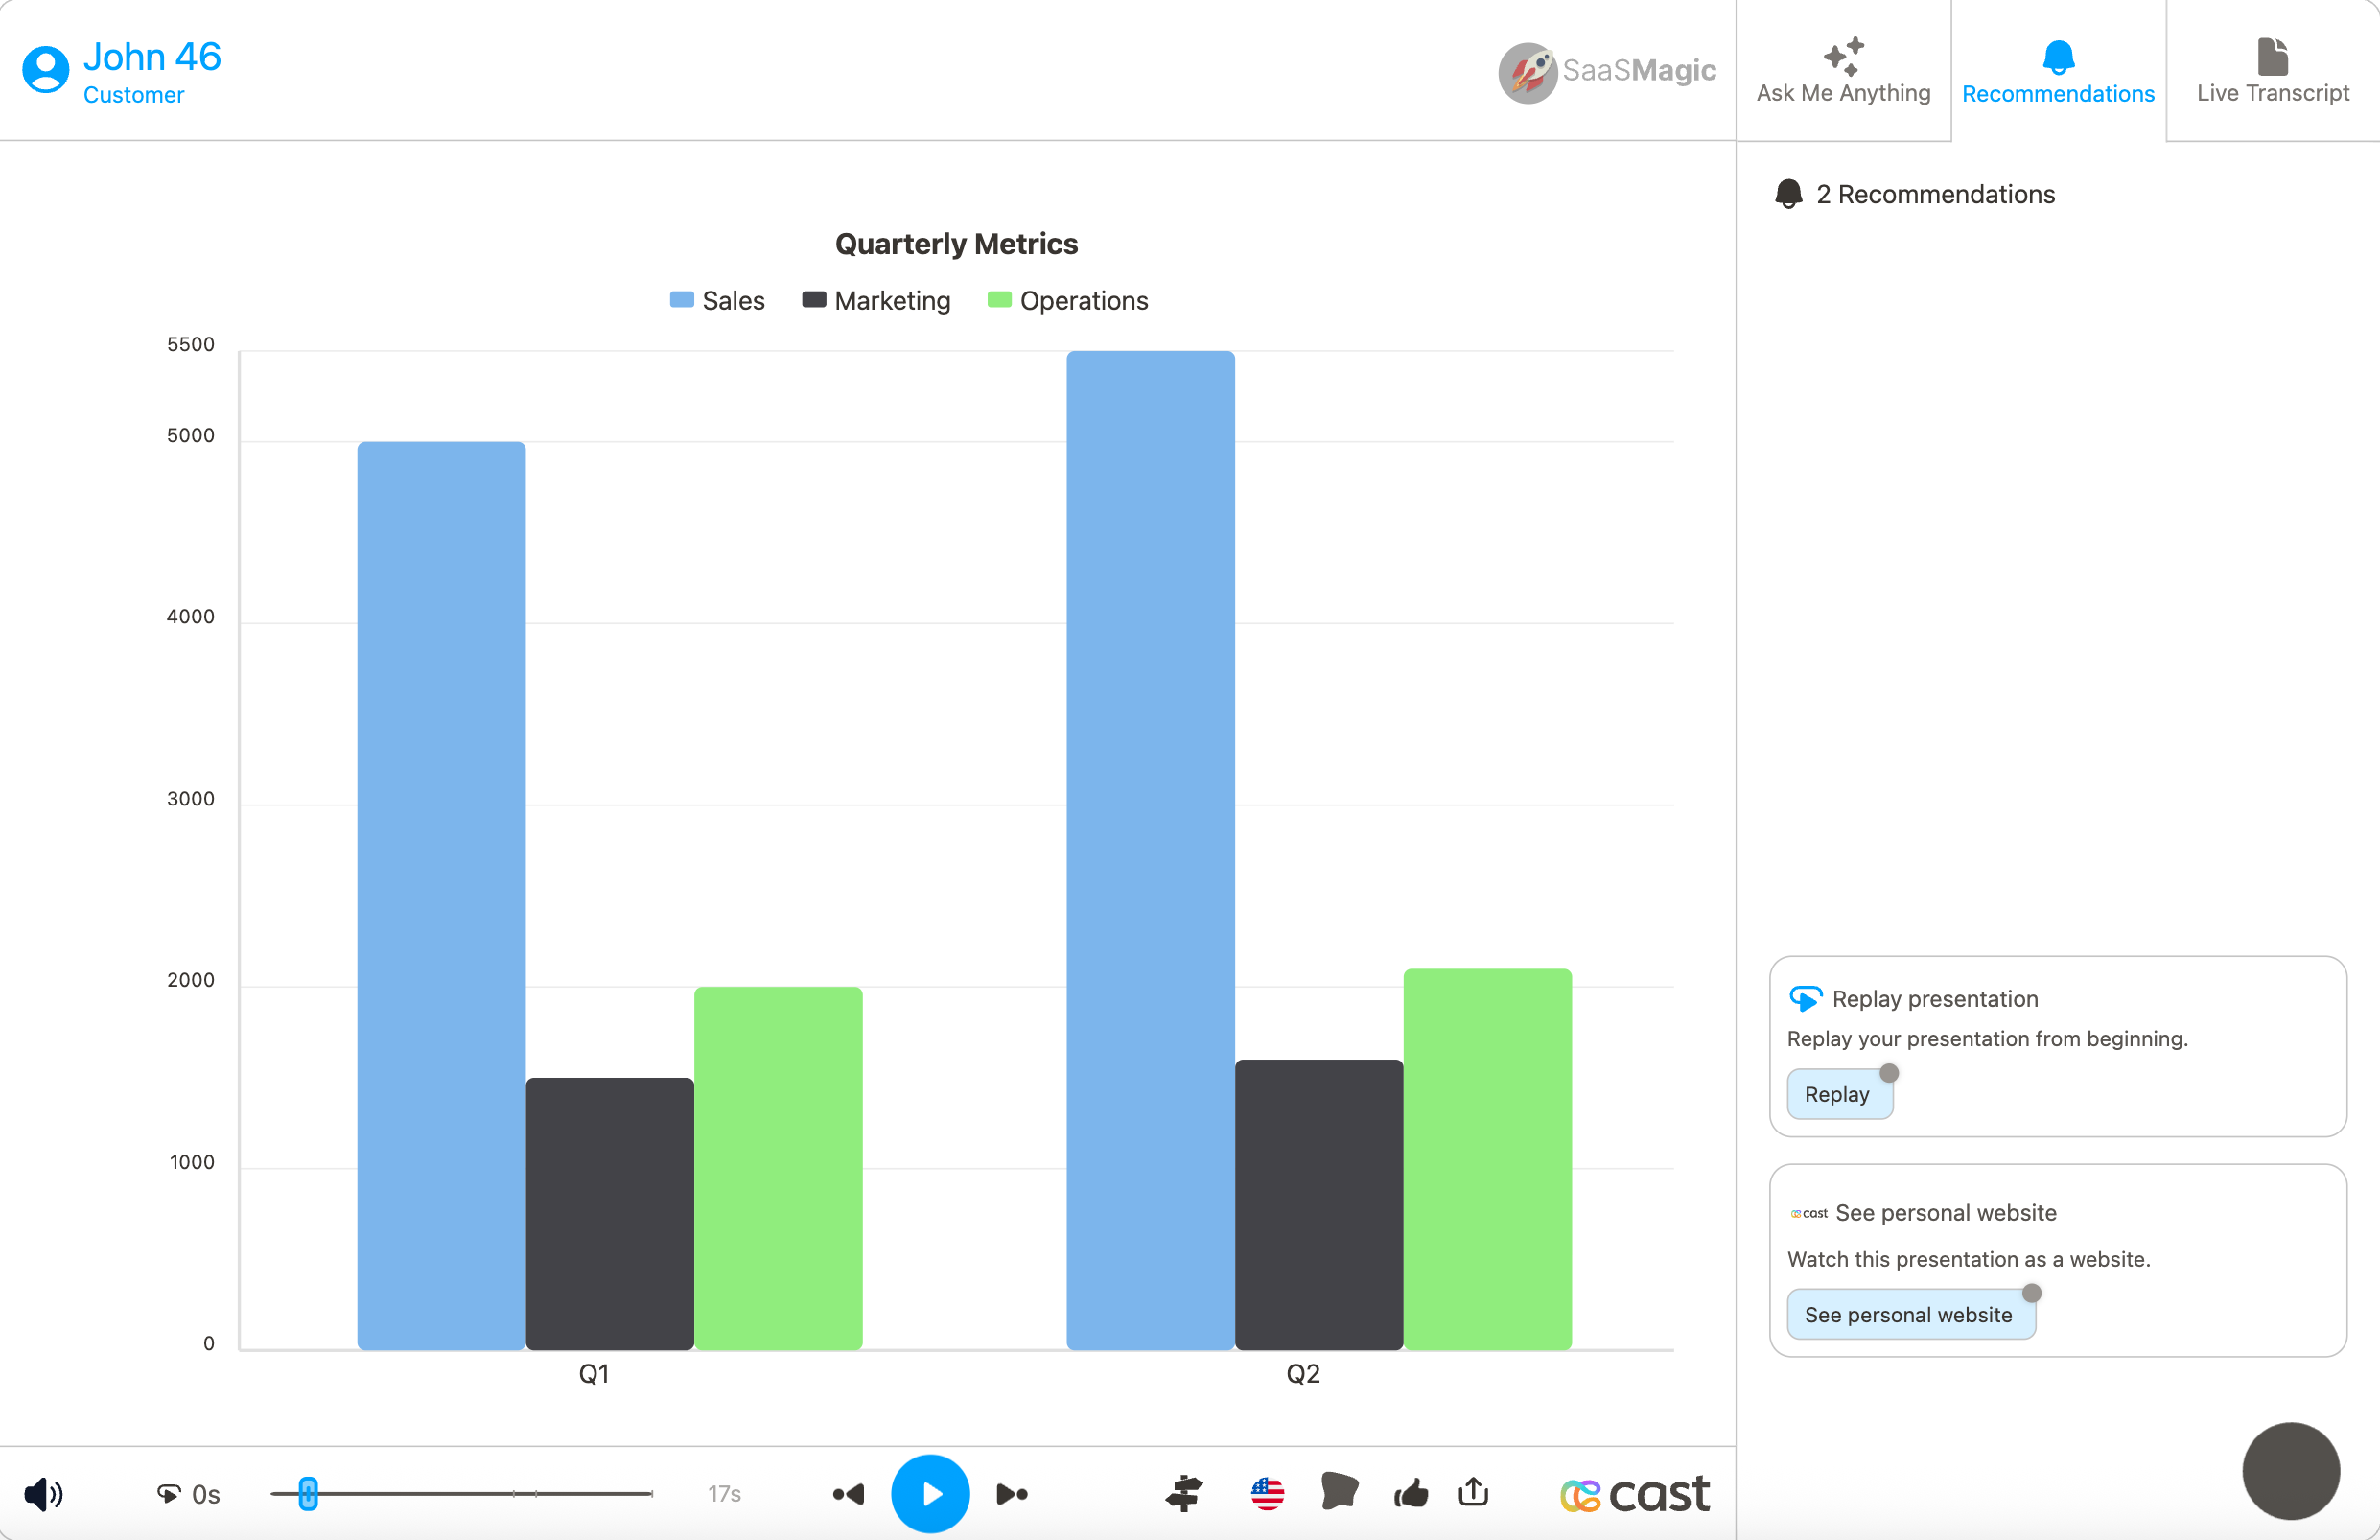 |
SVG | |
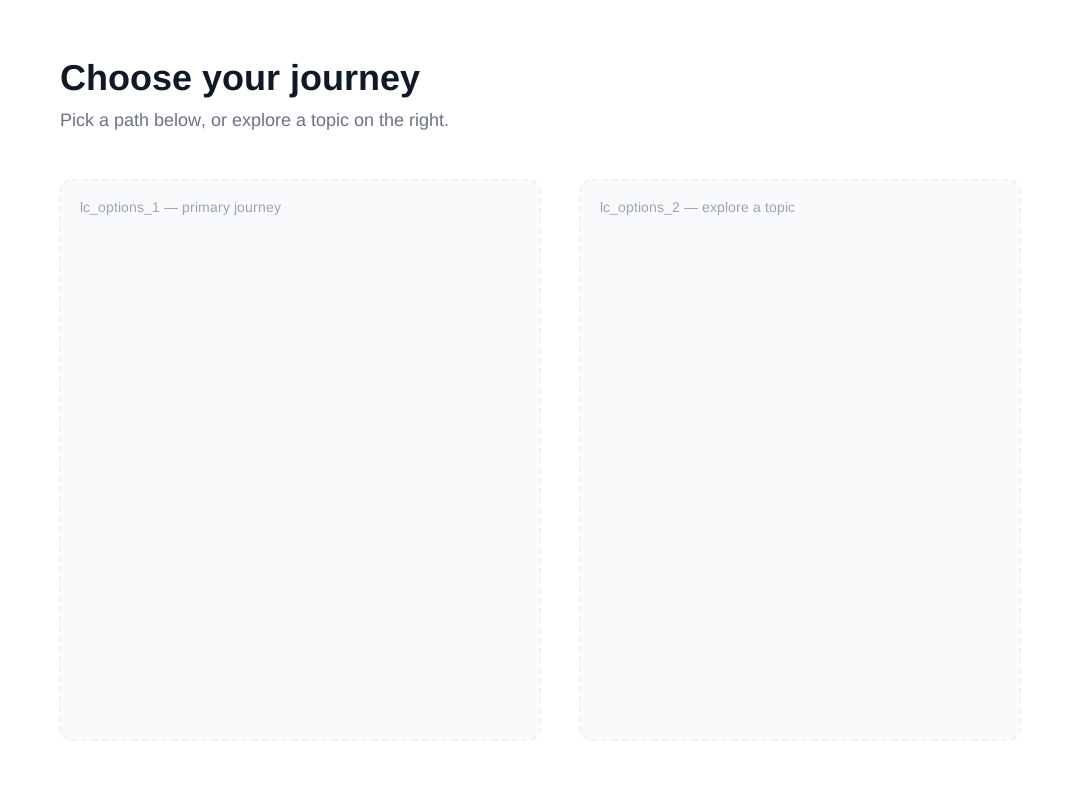
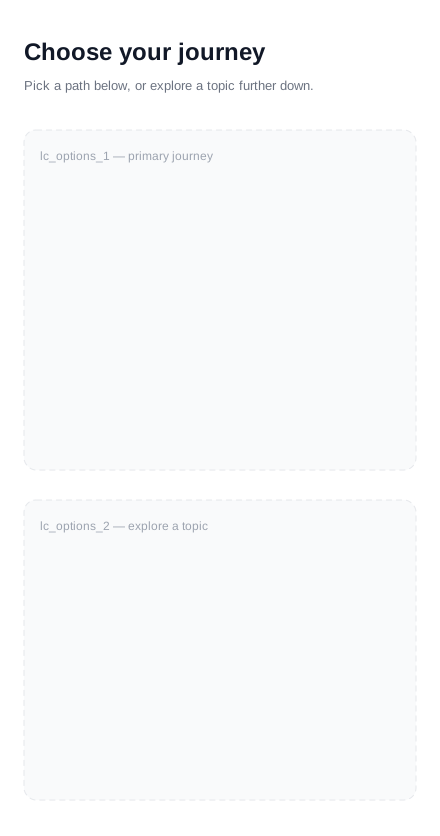
| lc_options | Splits a Navigation slide’s paths into multiple independently styled groups, each with its own desktop/mobile layout. | 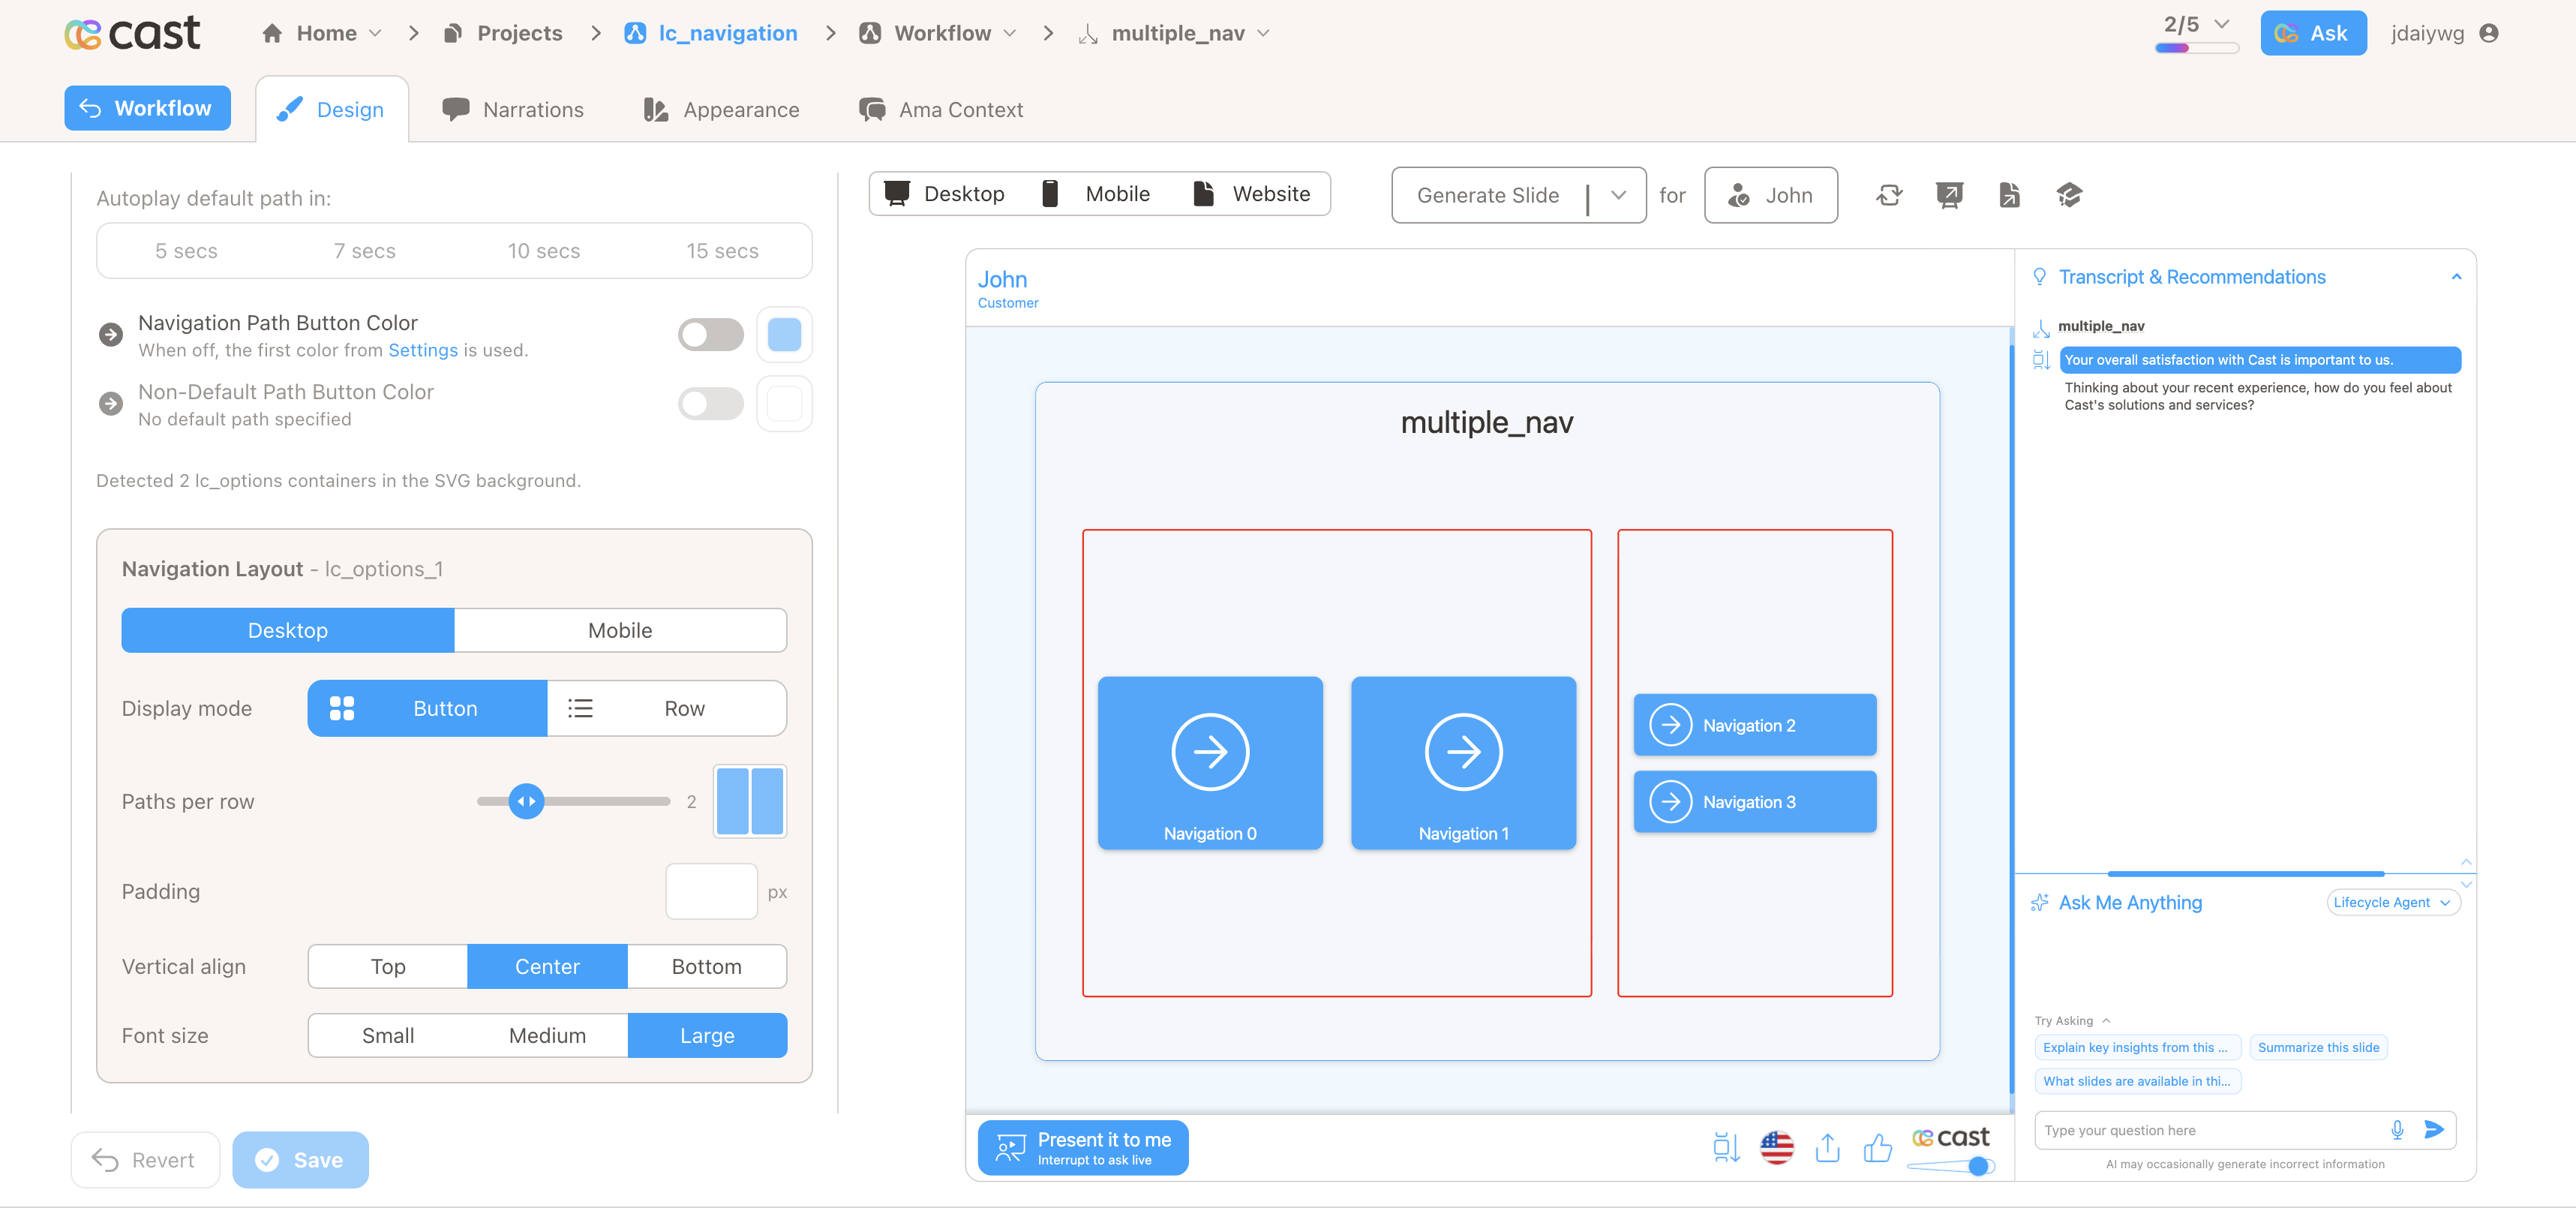 |
Desktop SVG / Mobile SVG | |
| lc_pdf | Embed a live, scrollable PDF (contracts, reports, one-pagers) directly on a slide. | 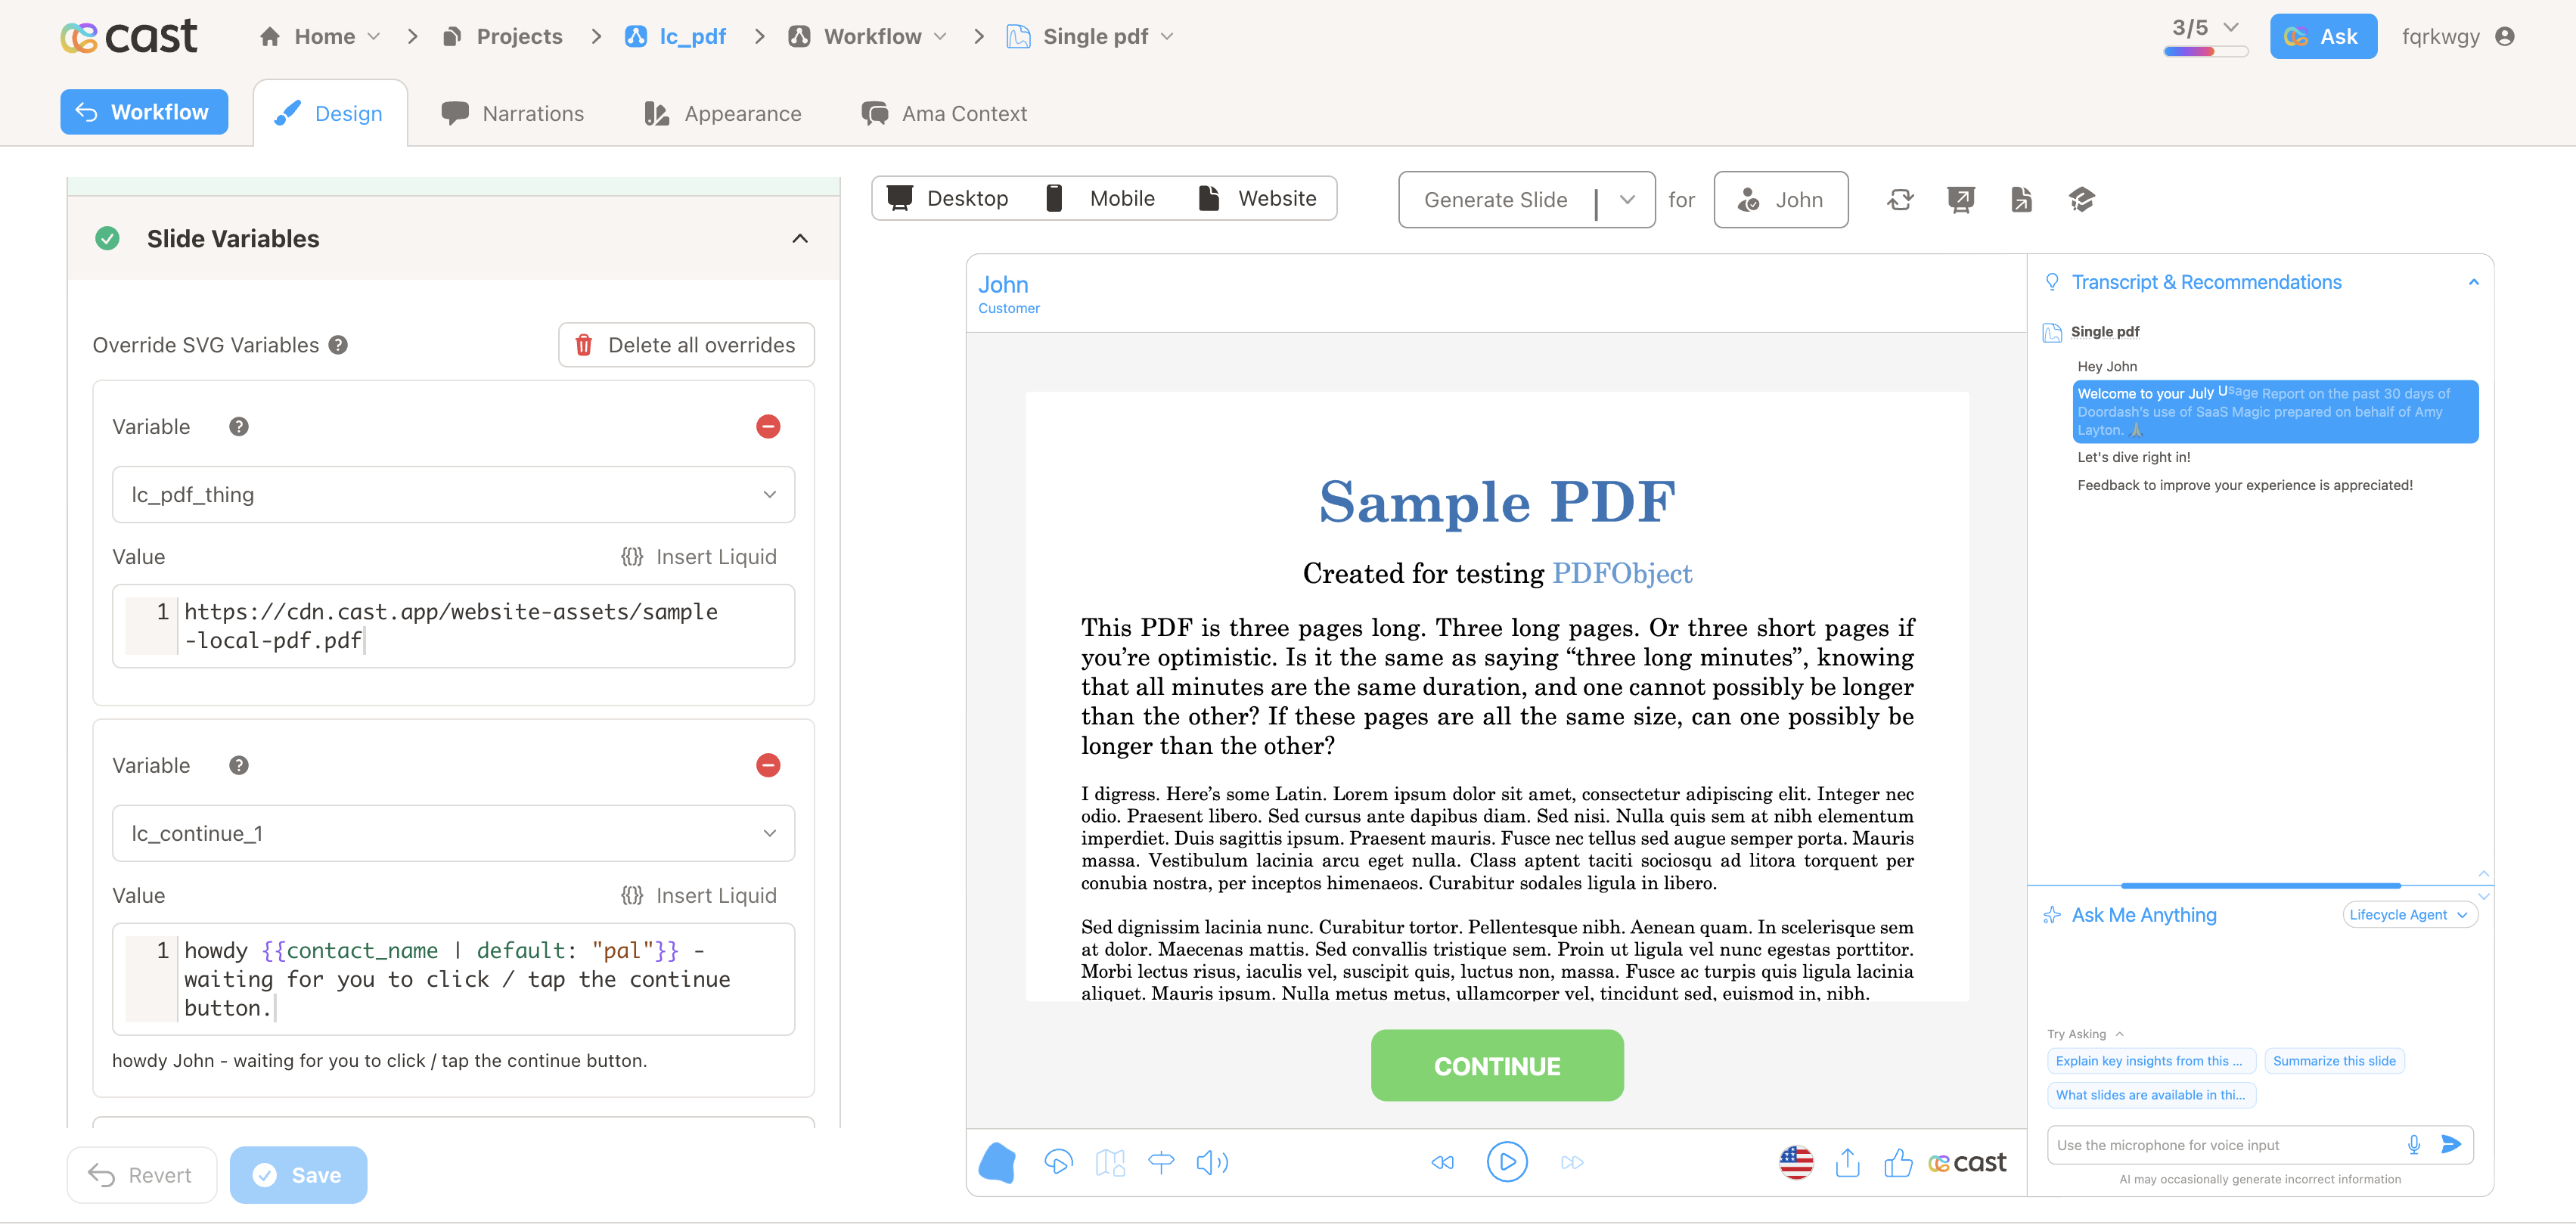 |
SVG | |
| lc_pie_bar | Horizontal stacked bar with legend (single-row proportions). | 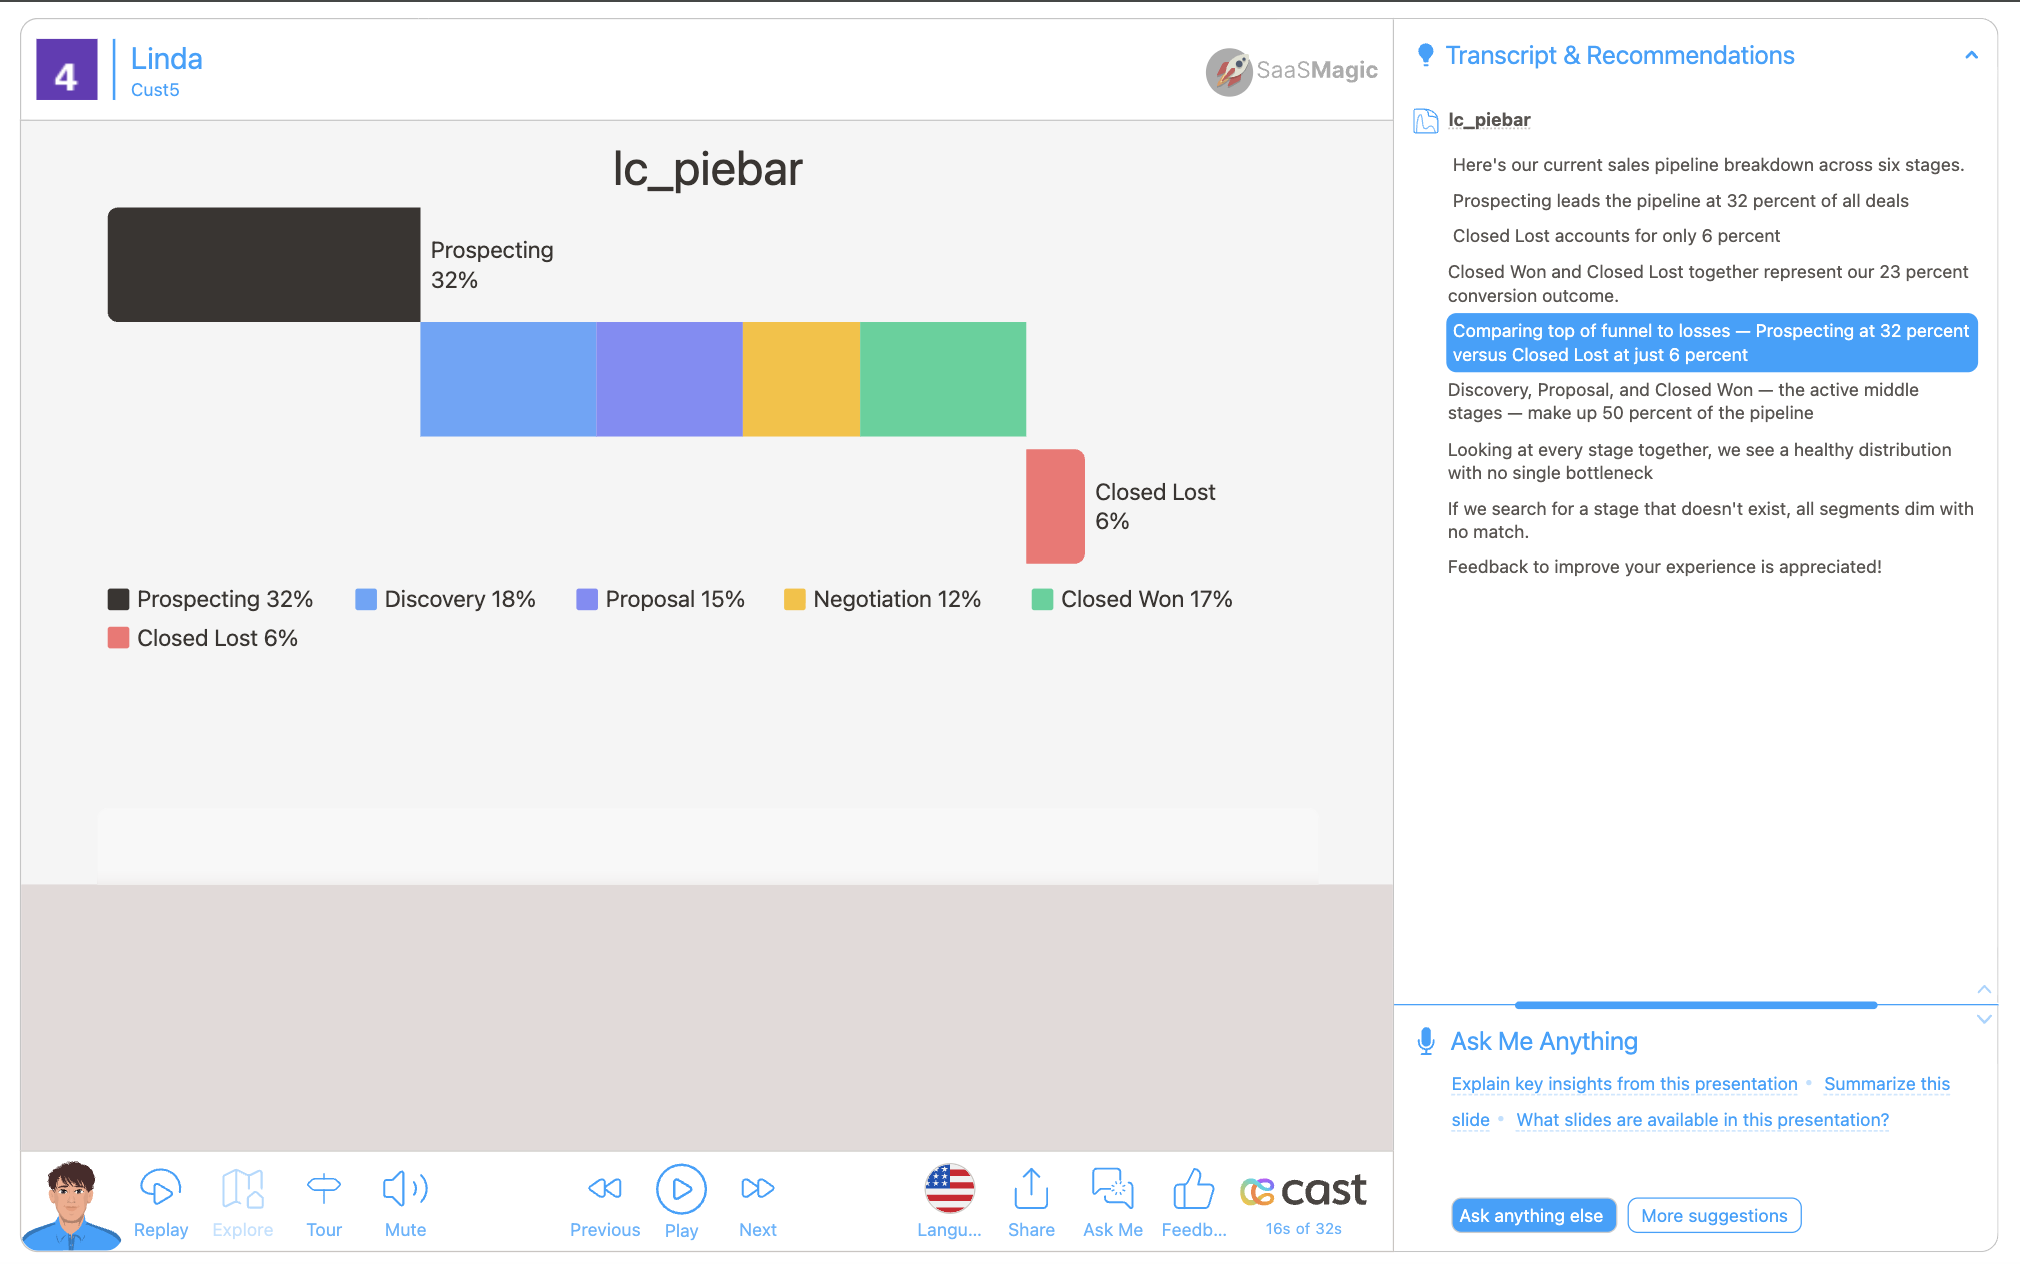 |
SVG | |
| lc_radial | Polar area (rose) chart for category magnitudes. | 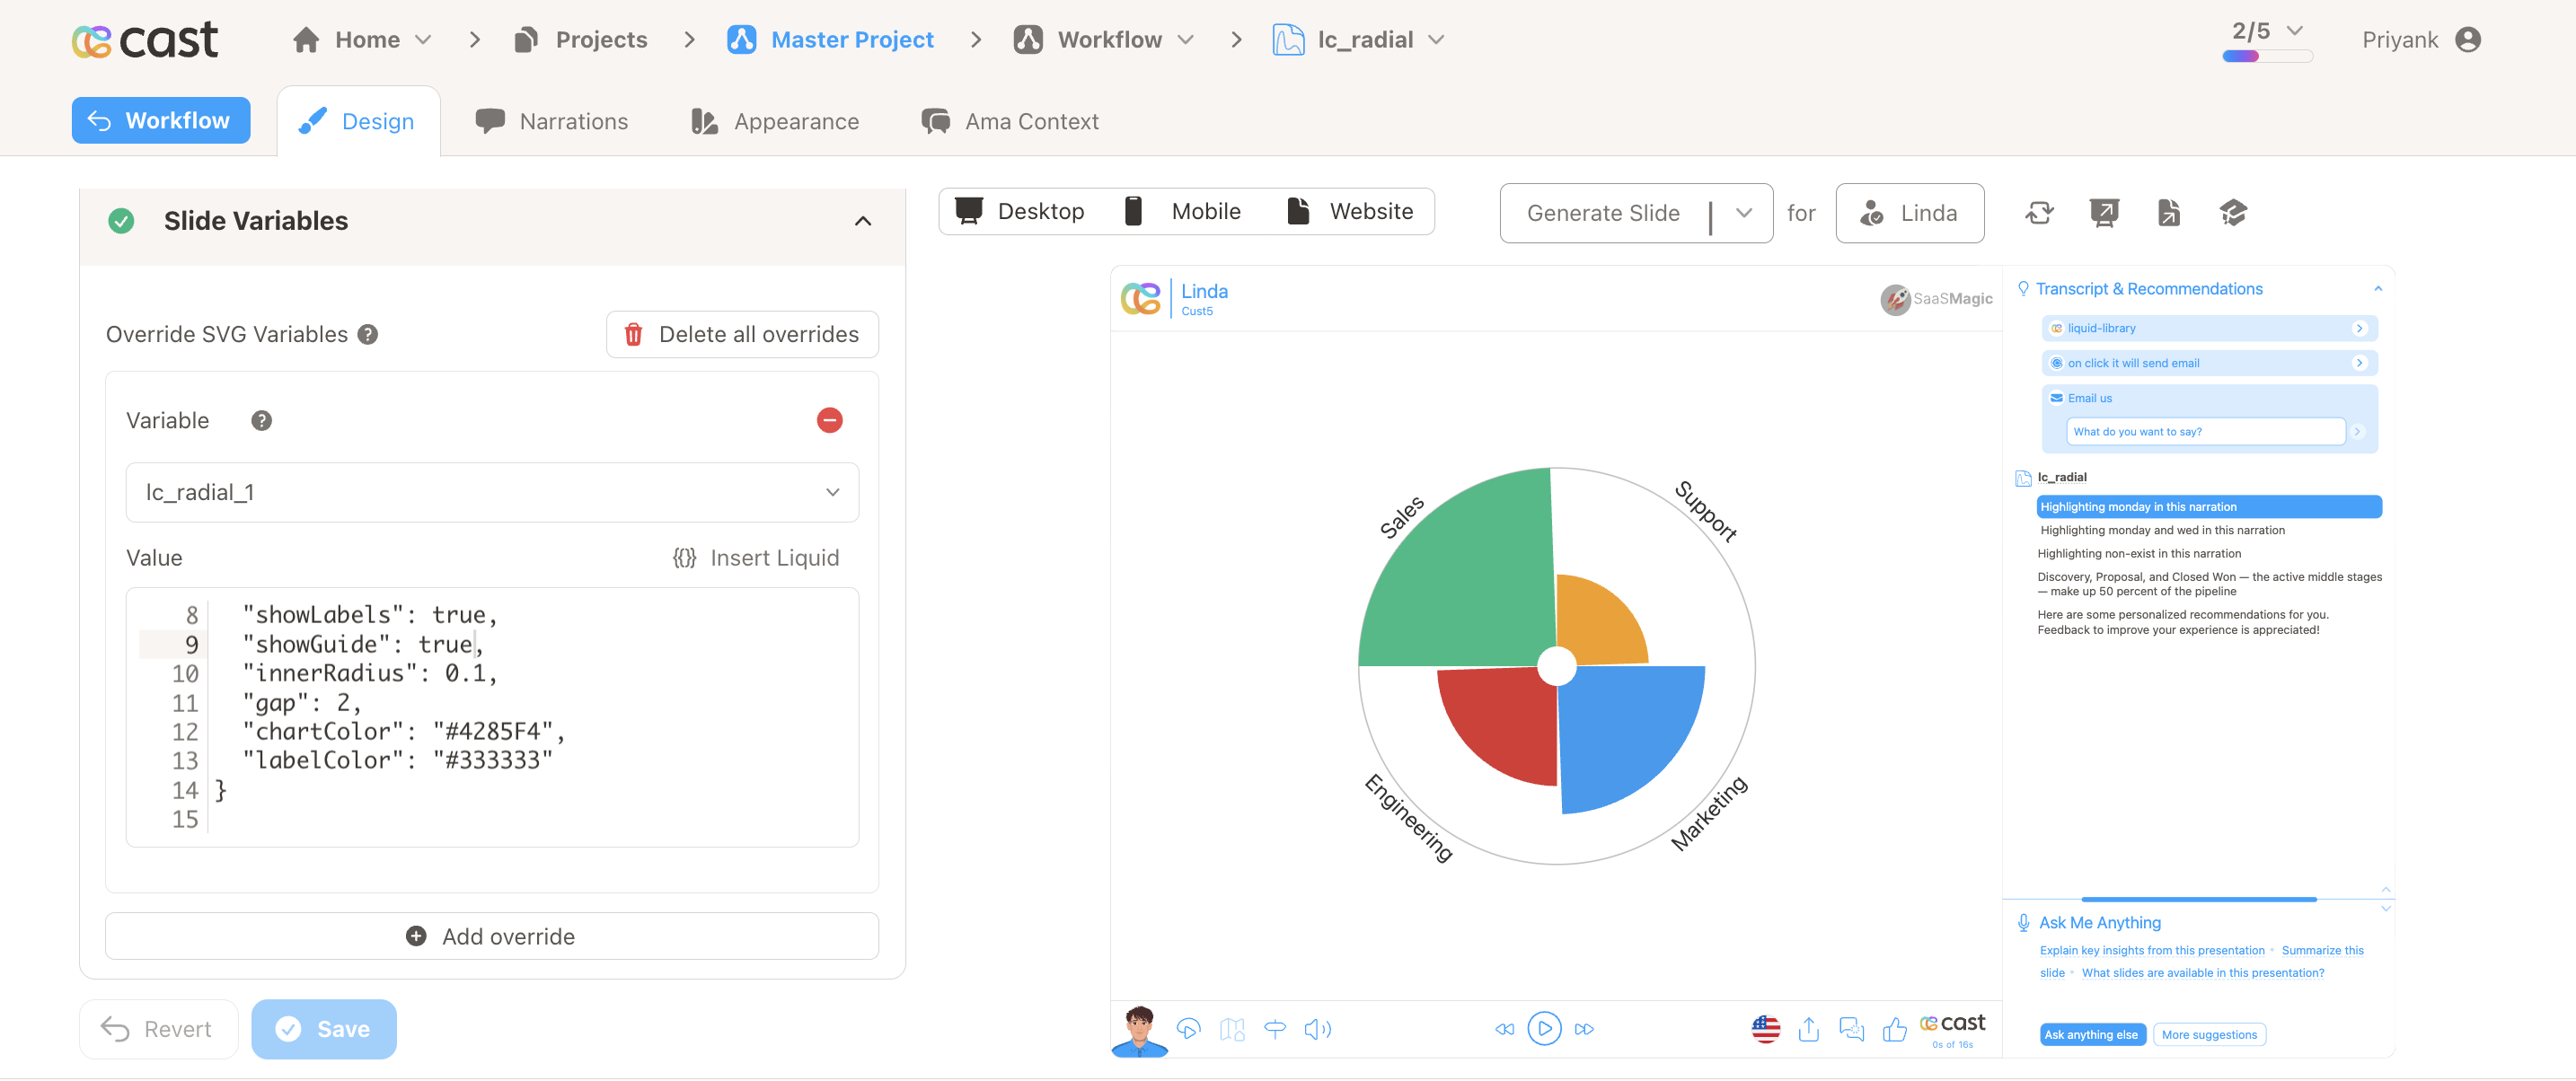 |
SVG | |
| lc_range / lc_range_bg | Min-max values or data ranges (position and width). | 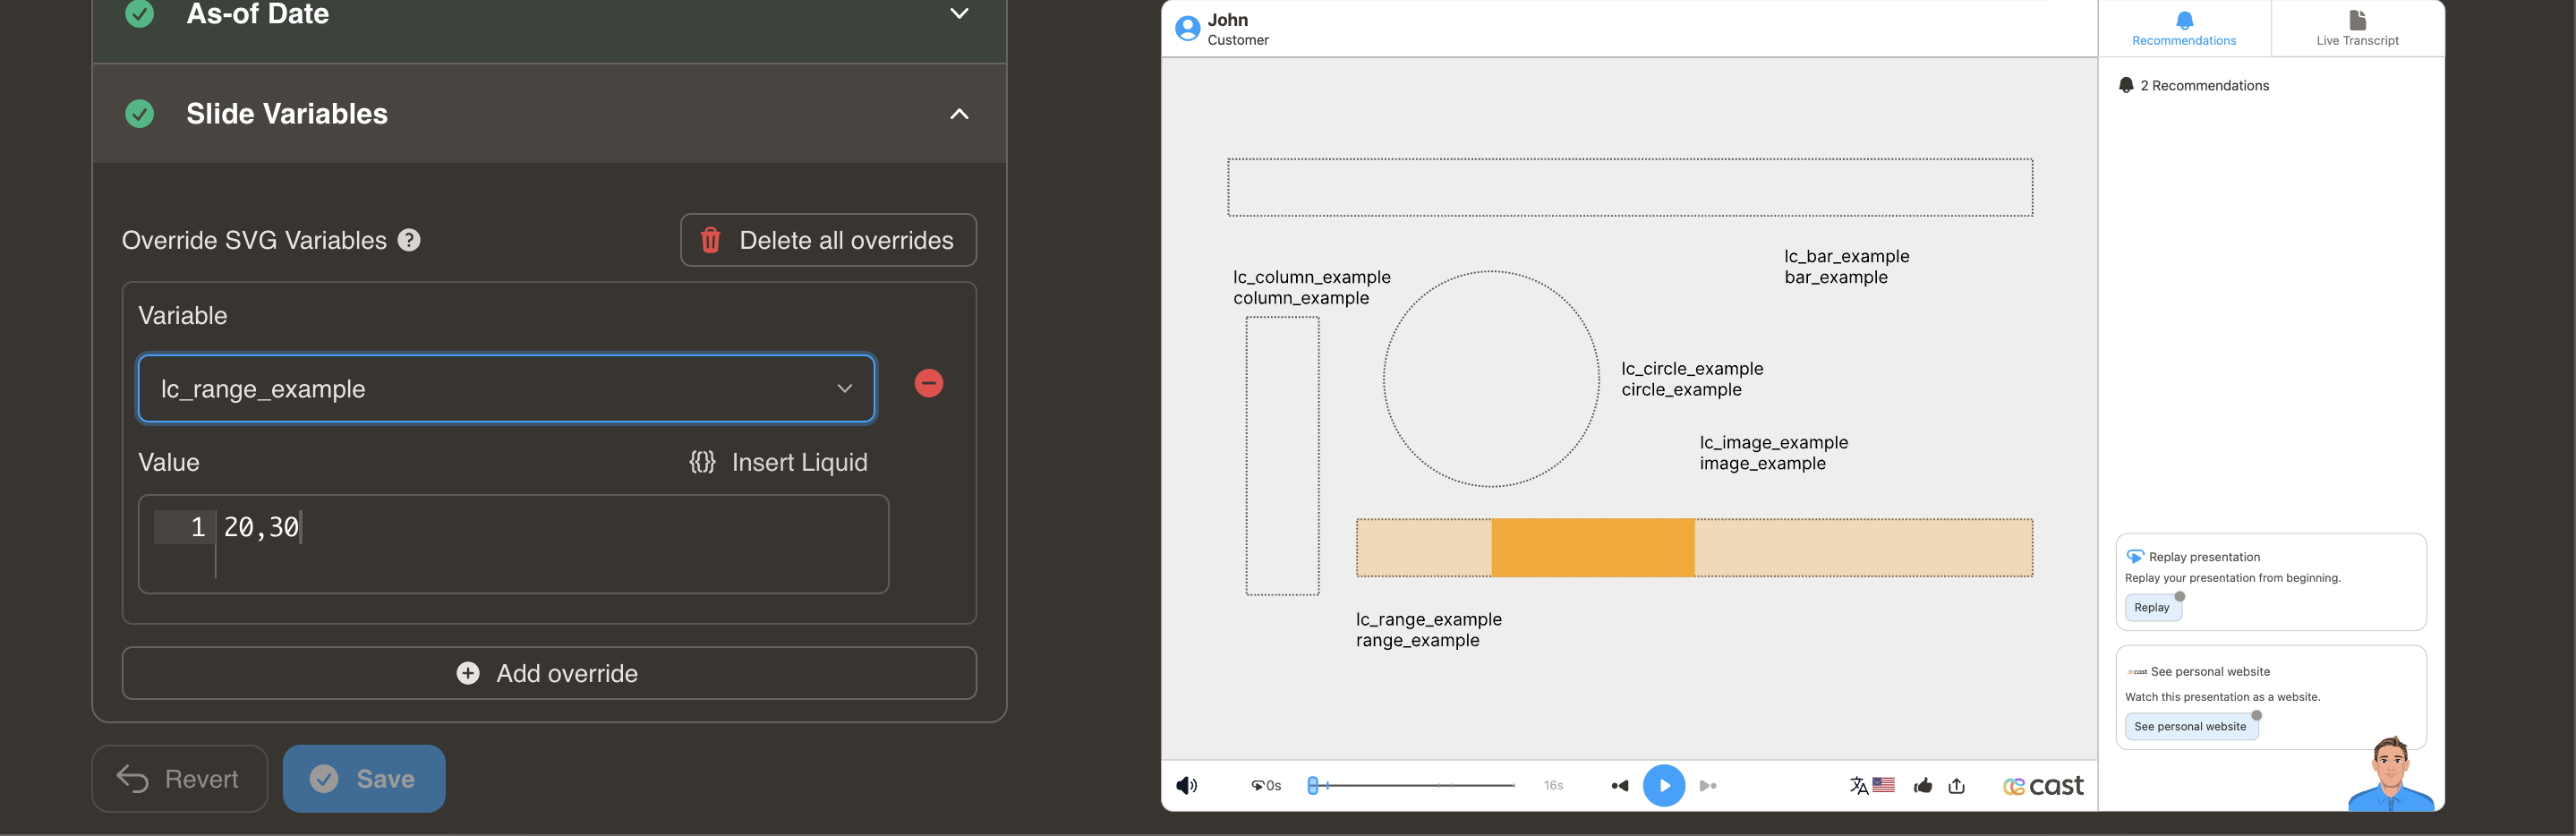 |
SVG | |
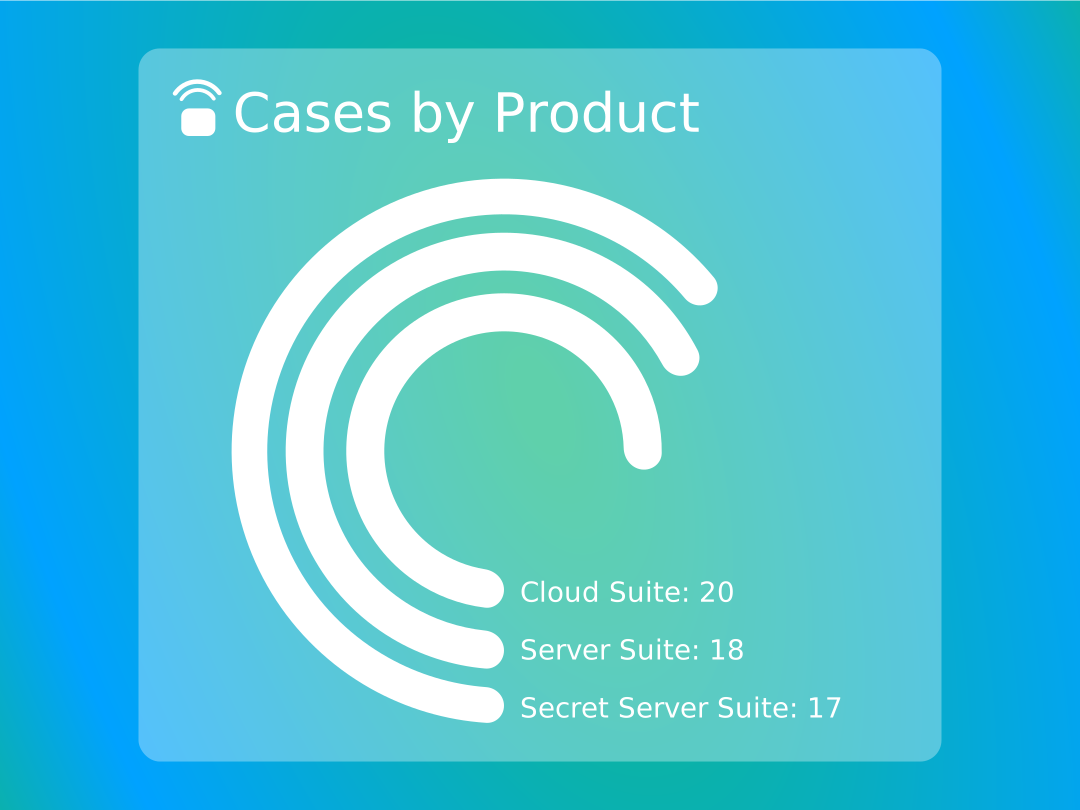
| lc_rings | Hierarchical or comparative data in concentric rings. | 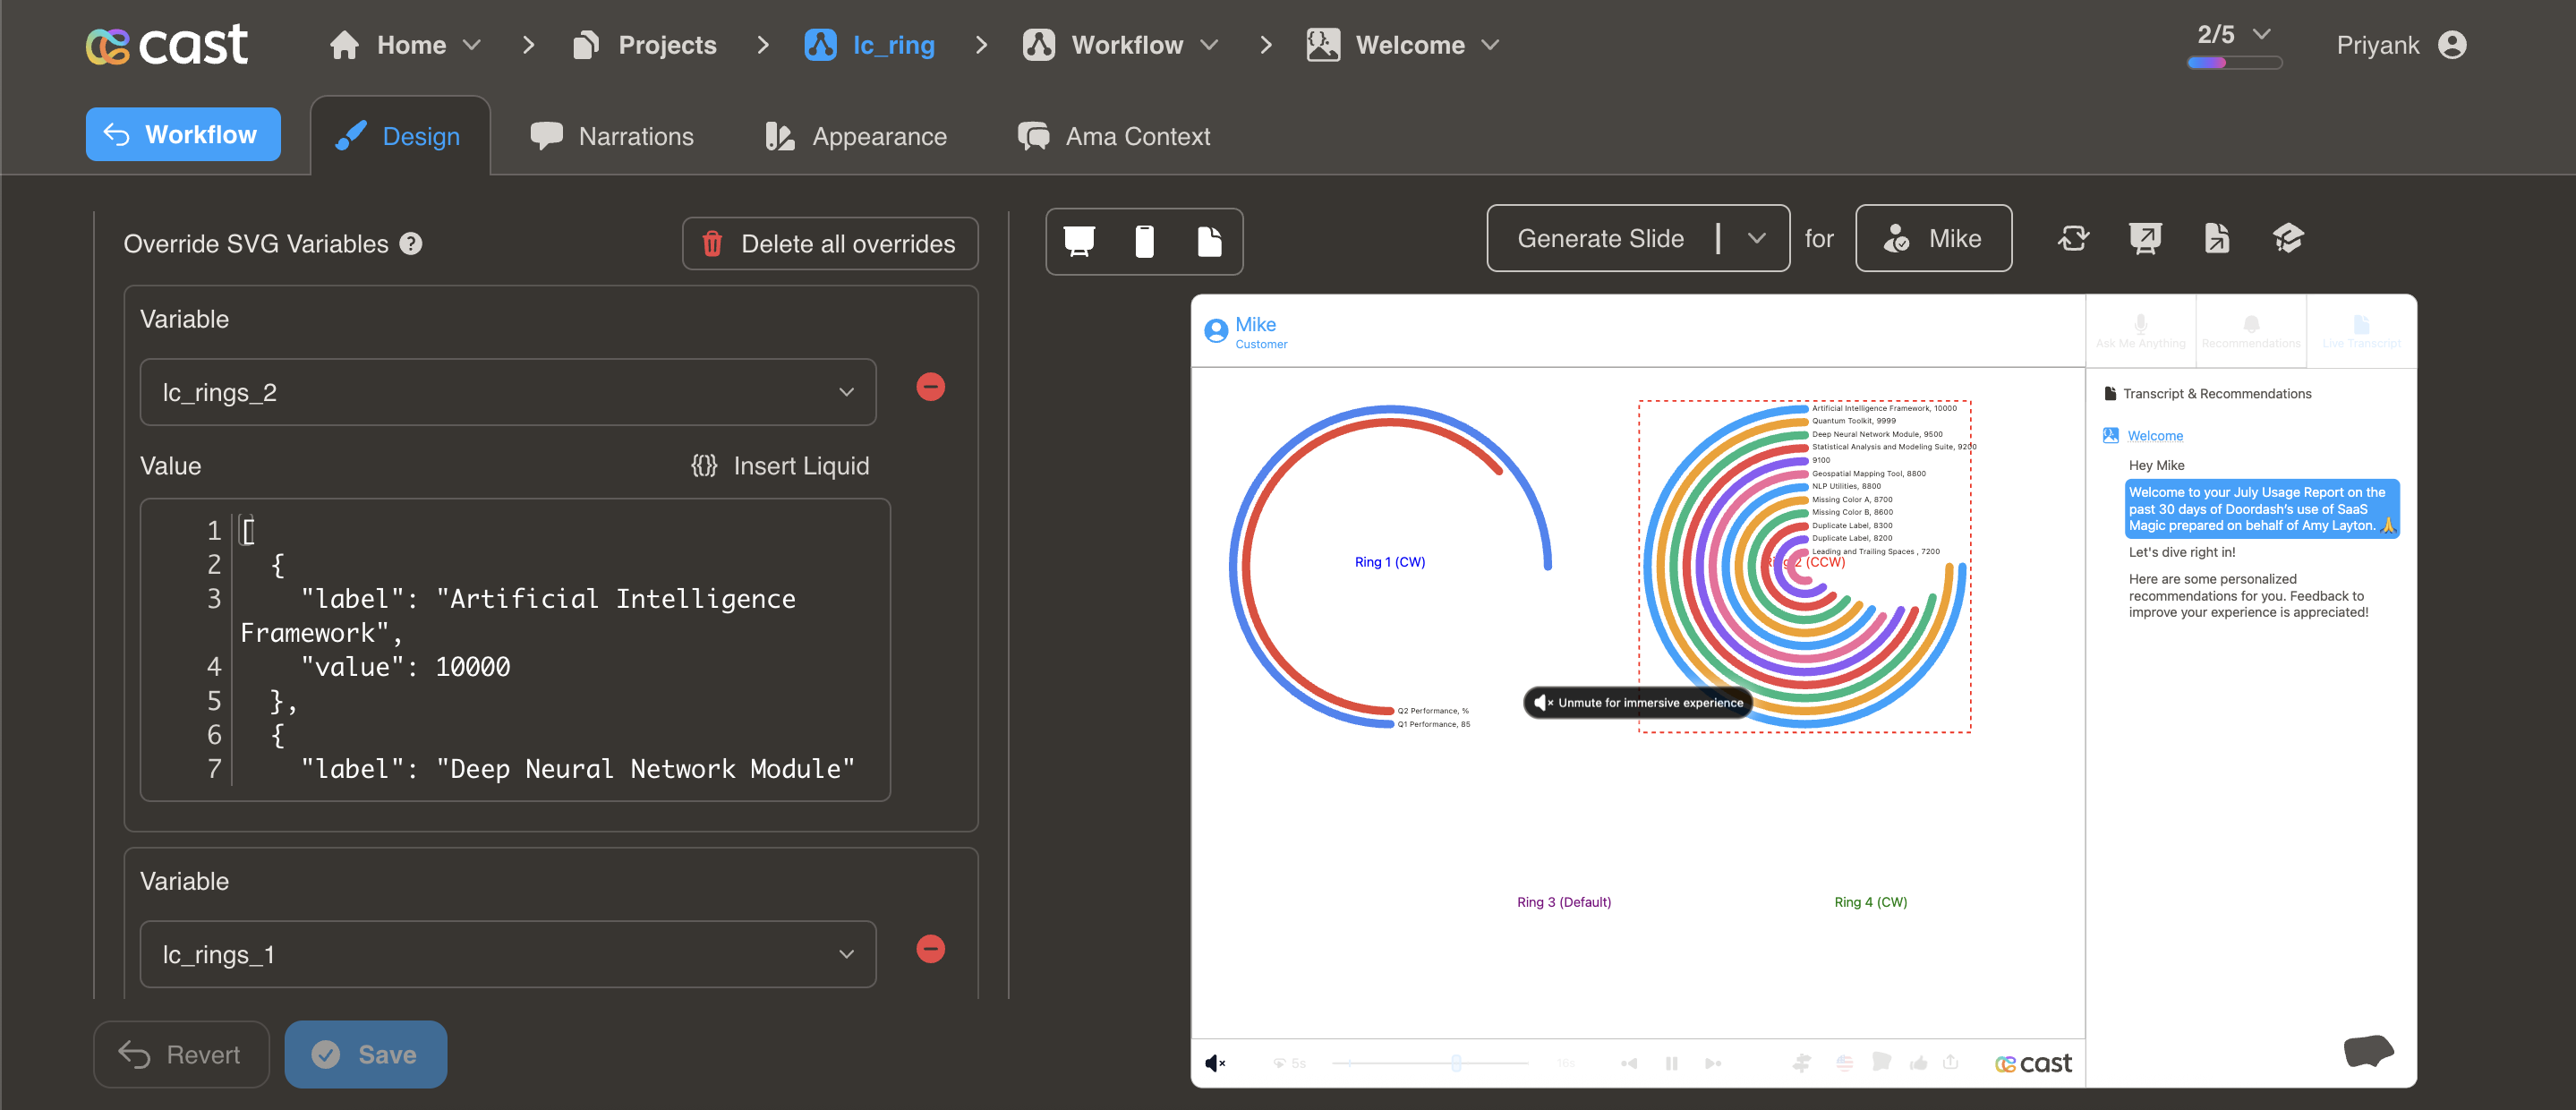 |
SVG | |
| lc_scrolltext | Long text that scrolls when it exceeds the container. | CSV | SVG | |
| lc_slope | Slope/trend between two values (before-after, comparisons). | 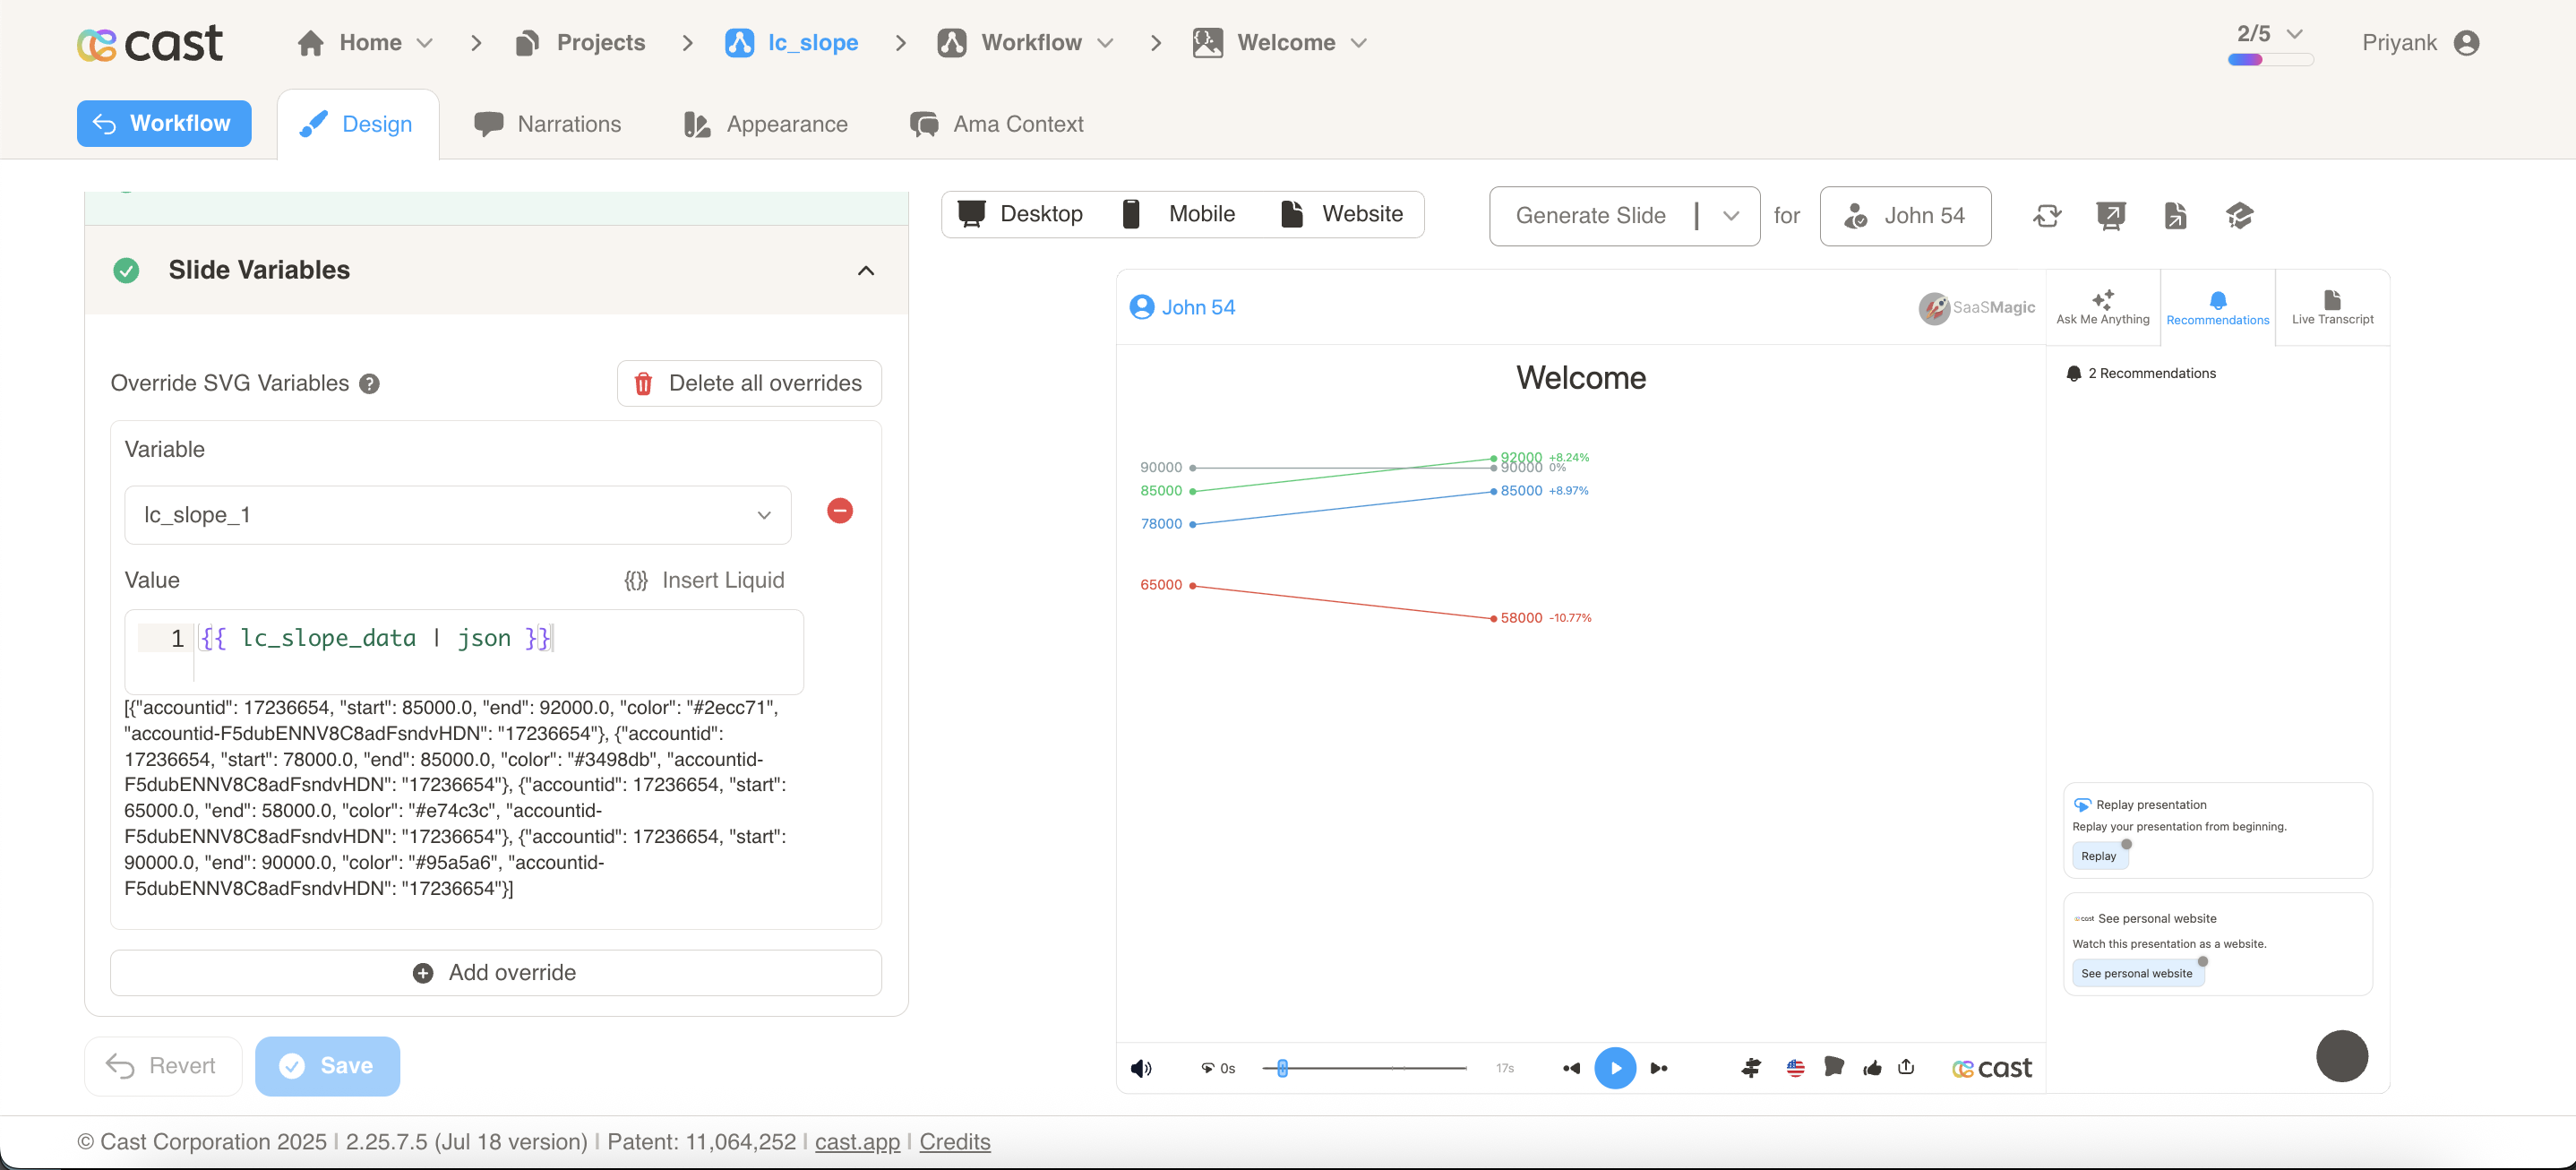 |
SVG | |
| lc_sparkline / lc_sparkbar / lc_sparkarea | Compact spark charts (line, bar, or area) for trends. | 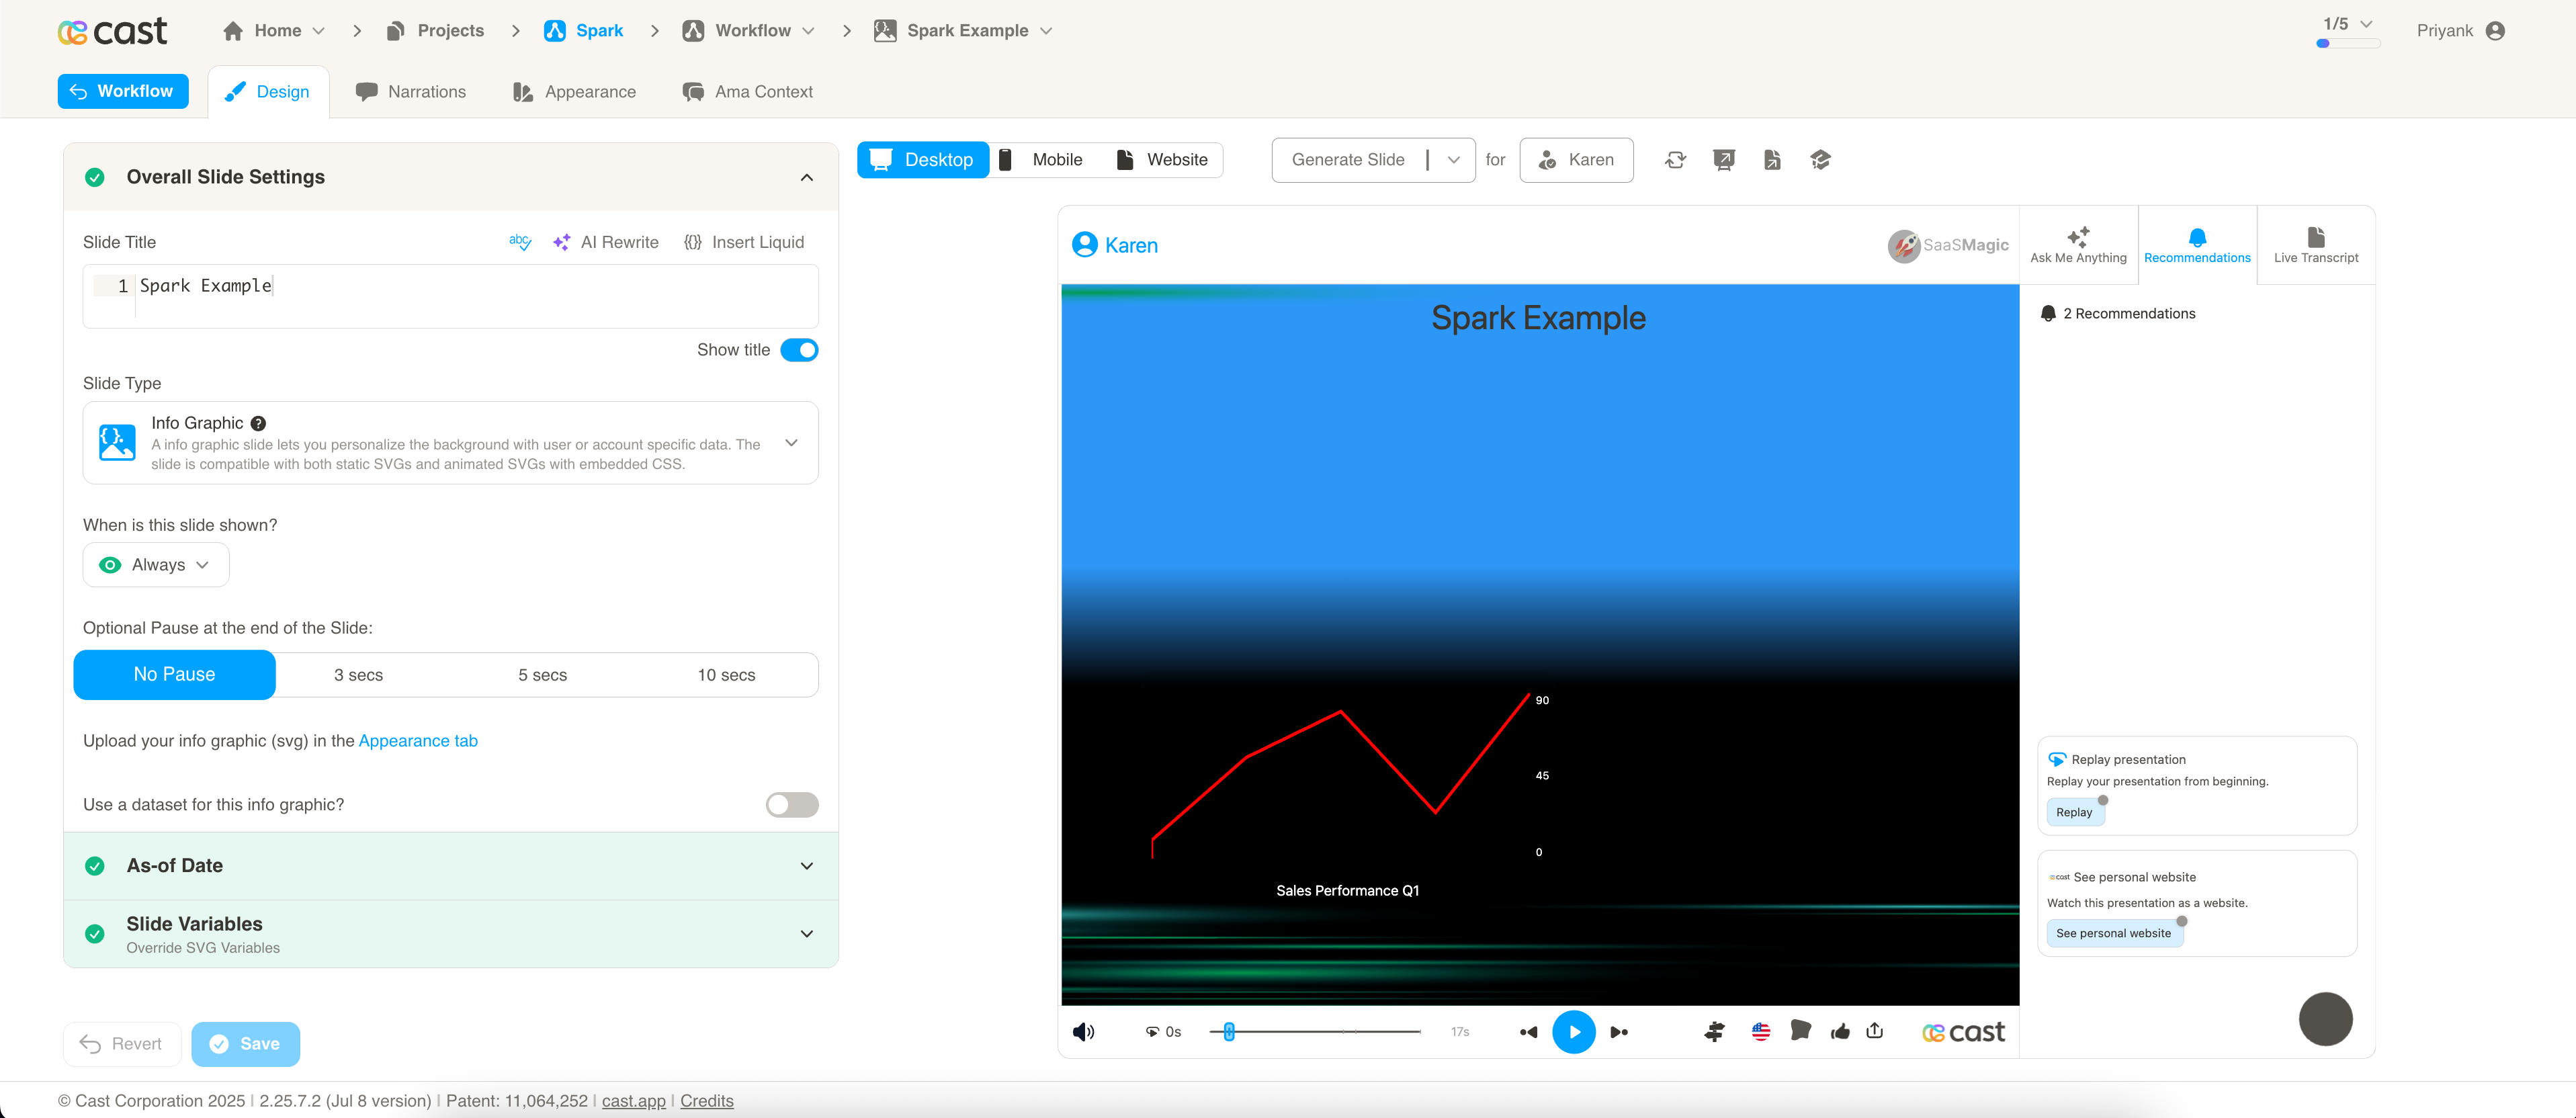 |
SVG | |
| lc_stacked_bars | Stacked bars for cumulative totals, part-to-whole. | 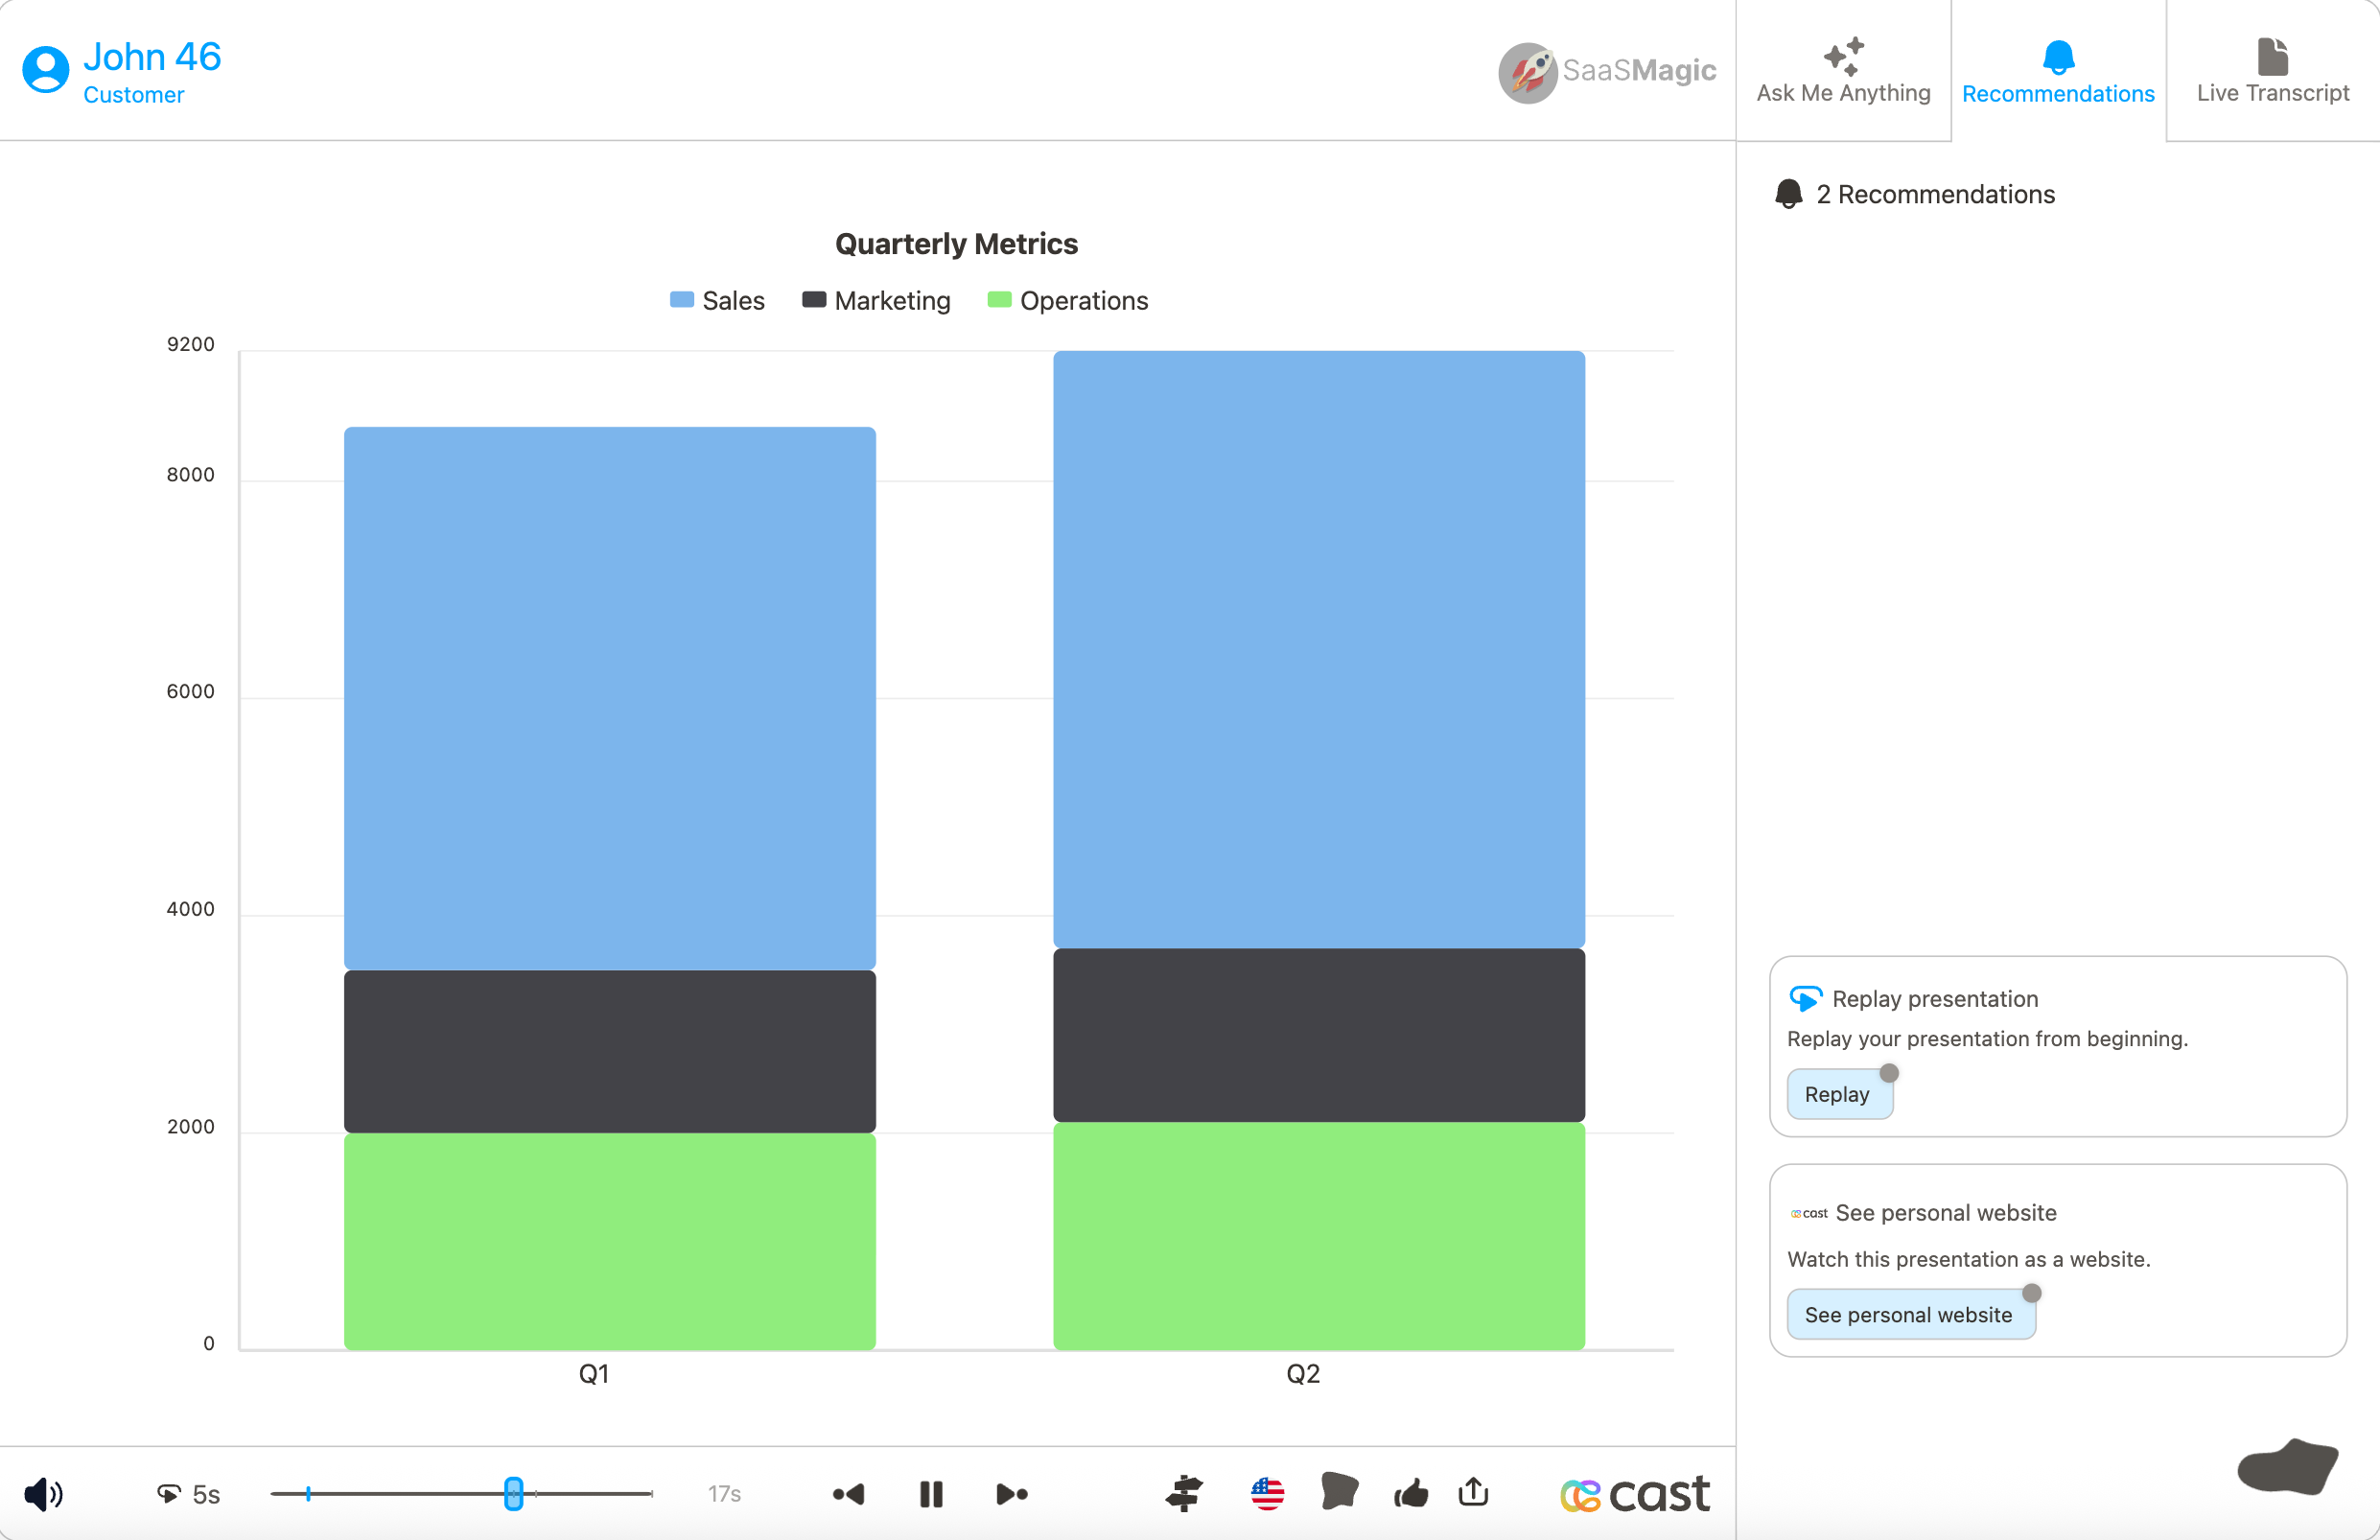 |
SVG | |
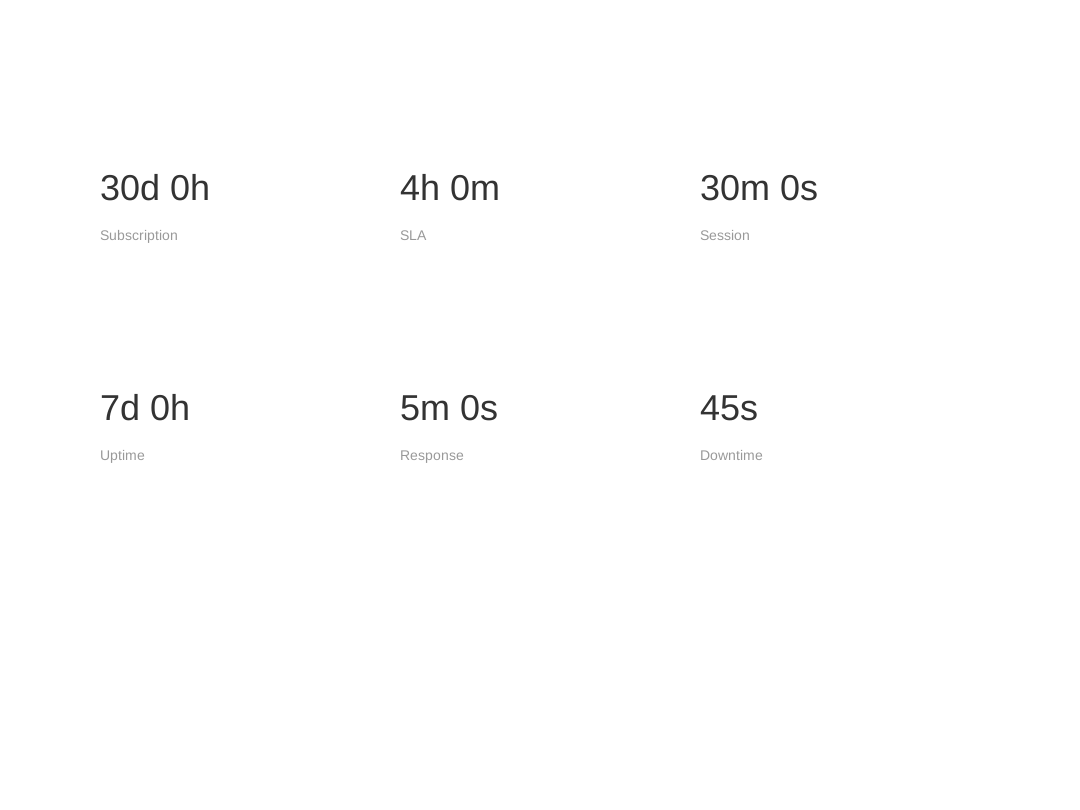
| lc_timerange | Human-readable time duration (e.g. 7d 0h, 2h 30m). |  |
SVG | |
| lc_video | Embedded video with autoplay (demos, tutorials). | CSV | SVG |

















Each element in the table above has a dedicated page with full configuration, examples, and troubleshooting. Click any name to go to its page.
Getting Started
Section titled “Getting Started”⚙️ New to Custom Slides?
Section titled “⚙️ New to Custom Slides?”Learn how to create and export SVGs from Figma or SVGator:
→ Setup & Export Guide{: .btn .btn-outline }
📋 Already Know What You Need?
Section titled “📋 Already Know What You Need?”Use the table above to jump to any element’s full configuration, or the quick syntax reference:
→ Quick Reference Cheat Sheet{: .btn .btn-outline }
How It Works
Section titled “How It Works”Custom slides use special ID naming conventions in your SVG files to create dynamic, personalized content:
- Text Personalization - Add
lc_variableNameto element IDs to replace with dynamic data - Show/Hide Elements - Use
lc_orhid_prefixes to control visibility - Dynamic Attributes - Special prefixes like
lc_bar_,lc_circle_, etc. adjust visual properties
Basic Example
Section titled “Basic Example”{% raw %}
<!-- In your SVG --><text id="lc_customer-name">John Doe</text><rect id="lc_bar_revenue" />
<!-- In your dataset -->{{ customer-name }} = "Acme Corp"{{ revenue }} = "75"
{% endraw %}
The slide will automatically replace “John Doe” with “Acme Corp” and set the bar width to 75%.
SVG Standards
Section titled “SVG Standards”- Desktop SVGs: 1080 x 810 pixels (4:3 aspect ratio)
- Mobile SVGs: 440 x 836 pixels (1:1.9 aspect ratio)
- Format: Static or animated SVGs with embedded CSS
- Animation: CSS-only animations supported (no JavaScript)
Need Help?
Section titled “Need Help?”- Elements and widgets table - Jump to any element’s full configuration
- Setup & Export Guide - Learn how to create proper SVGs
- Quick Reference - Syntax cheat sheet
- FAQ - Common questions and troubleshooting