Analytics
To view analytics for a specific campaign, first click on Project, then hover over the Workflow breadcrumbs and select Campaigns. Choose the campaign you want to analyze, and click on the Analytics button. In the Analytics tab, you can view the Delivery Metrics and Analytics for each campaign. Click on the Delivery Metrics title to open the delivery dropdown.
Delivery Metrics
The following example shows email delivery metrics. You may click on each metric to view a popup with all the email events for that metric.
Analytics
The following analytics are captured by cast:
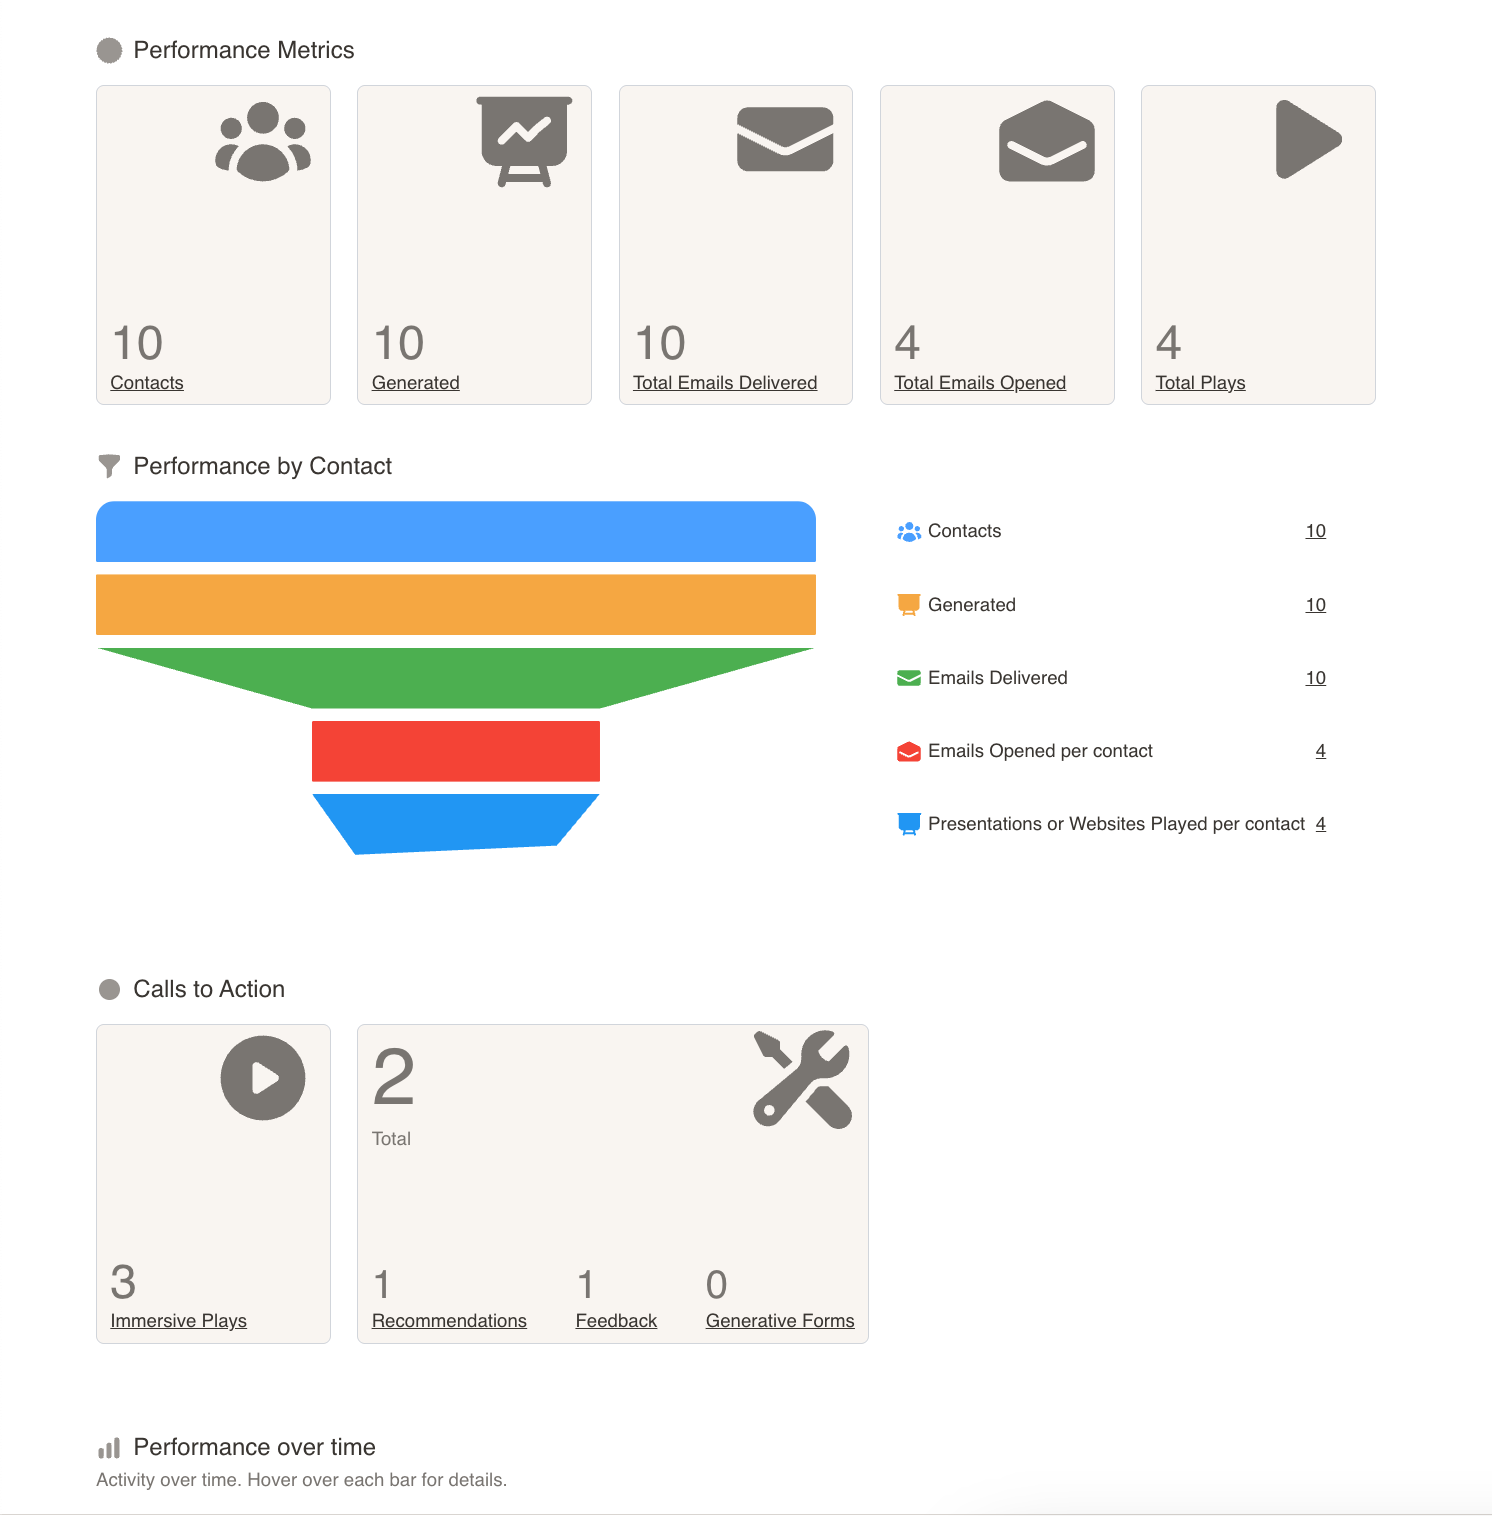
Performance Metrics
The top section displays the primary metrics:
- Contacts: Total number of recipients in your campaign
- Generated: Number of content items created for the campaign
- Total Emails Delivered: Count of successfully delivered emails
- Total Emails Opened: Count of emails that were opened by recipients
- Total Plays: Number of times your presentations or videos were played
Performance by Contact This funnel visualization shows the progression of engagement:
- Contacts: Starting audience size
- Generated: Content items created
- Emails Delivered: Successfully delivered emails
- Emails Opened per contact: Number of unique opens
- Presentations or Websites Played per contact: Number of content views
Calls to Action This section tracks specific interactions with your content:
- Immersive Plays: Number of times presentations were viewed in immersive mode
- Recommendations: Count of clicks on recommendation links
- Feedback: Amount of feedback submissions received
- Generative Forms: Number of submitted generative forms
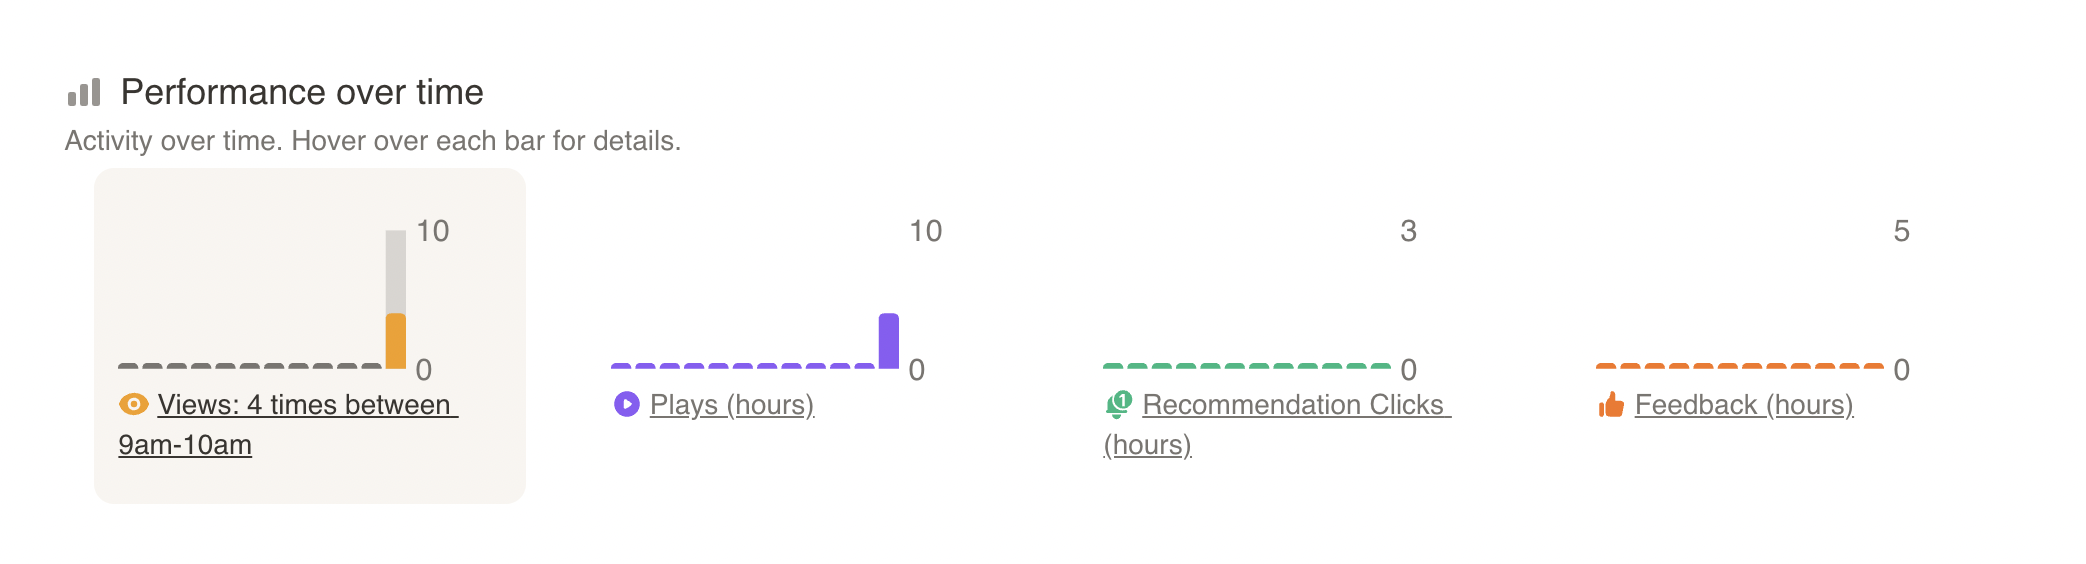
Performance over time
See activity and engagement with presentations over time. Hover over each bar to see the views, plays, recommendation clicks, and feedback for each hour.
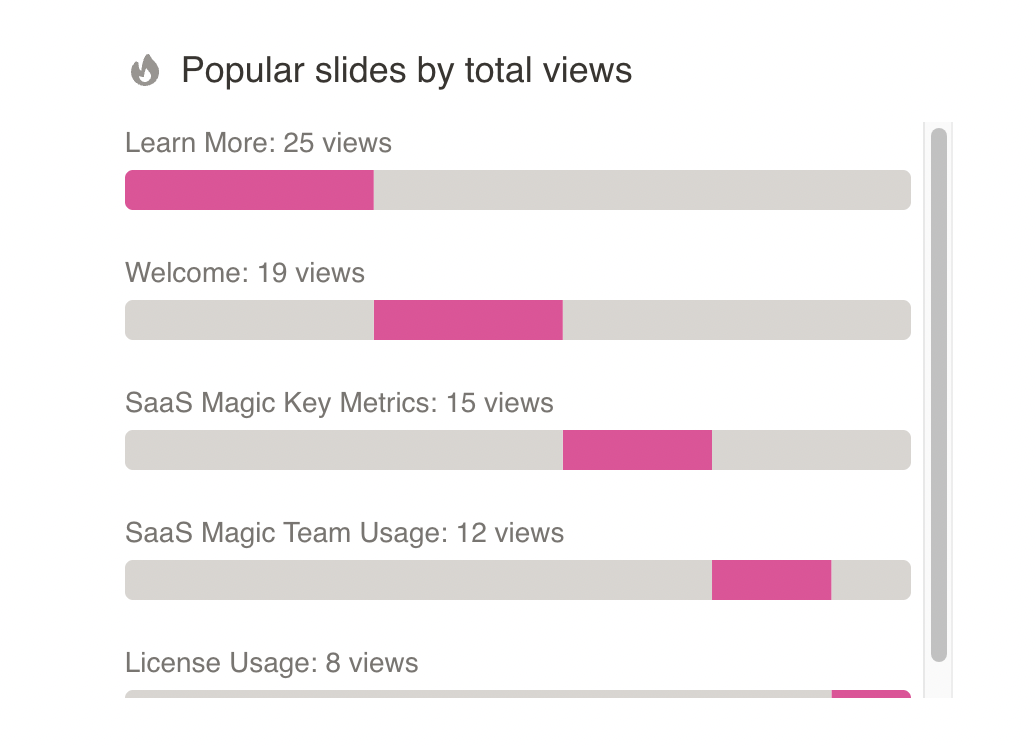
Popular slides by total views
See which slides are grabbing the most attention, and which ones are getting the least.
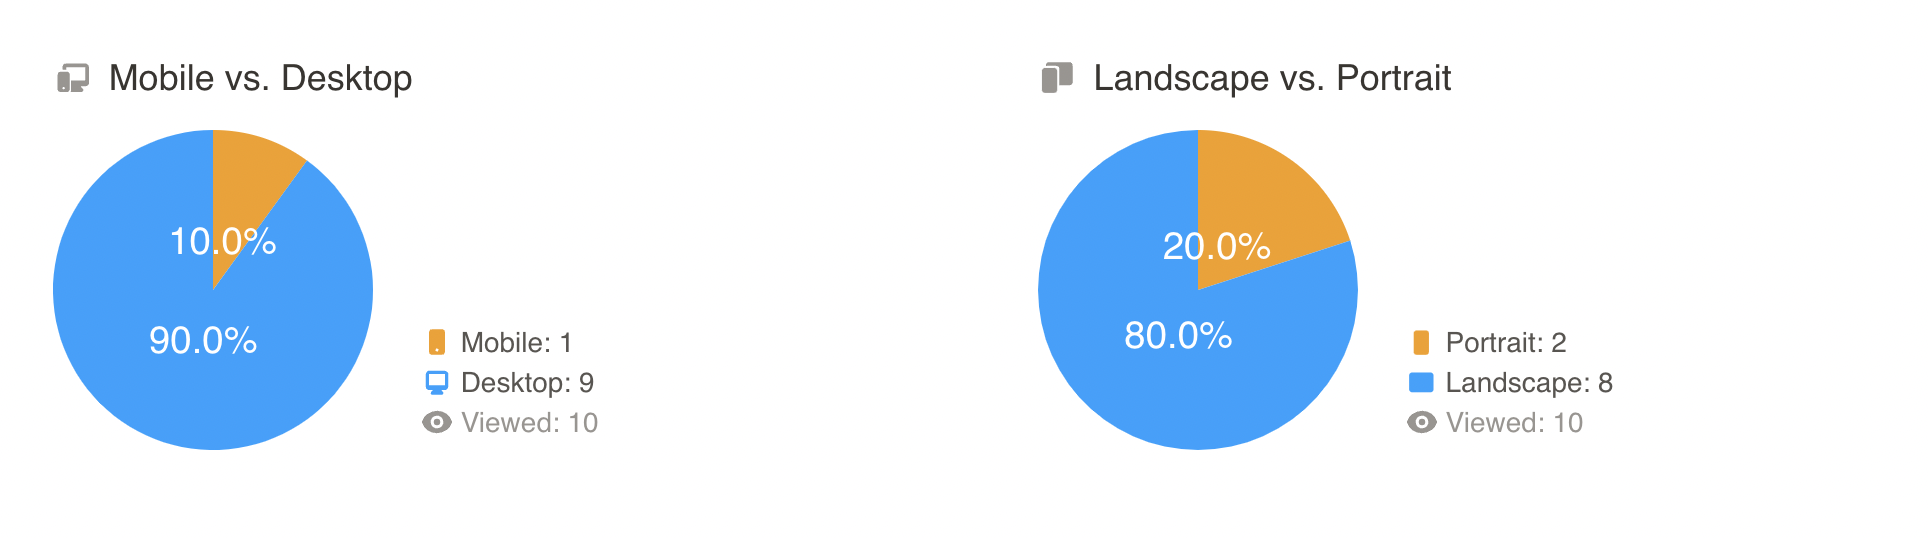
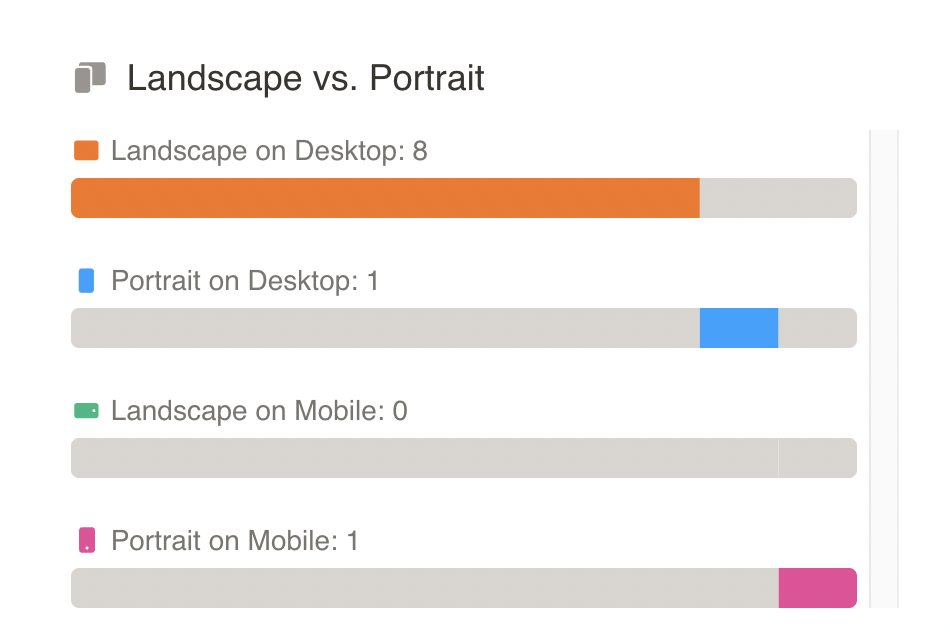
Mobile vs. Desktop and Landscape vs. Portrait
Check analytics for mobile vs. desktop views, and landscape vs. portrait views. This will give you a better understanding of your audience and allow you to tailor your casts to suit their needs.
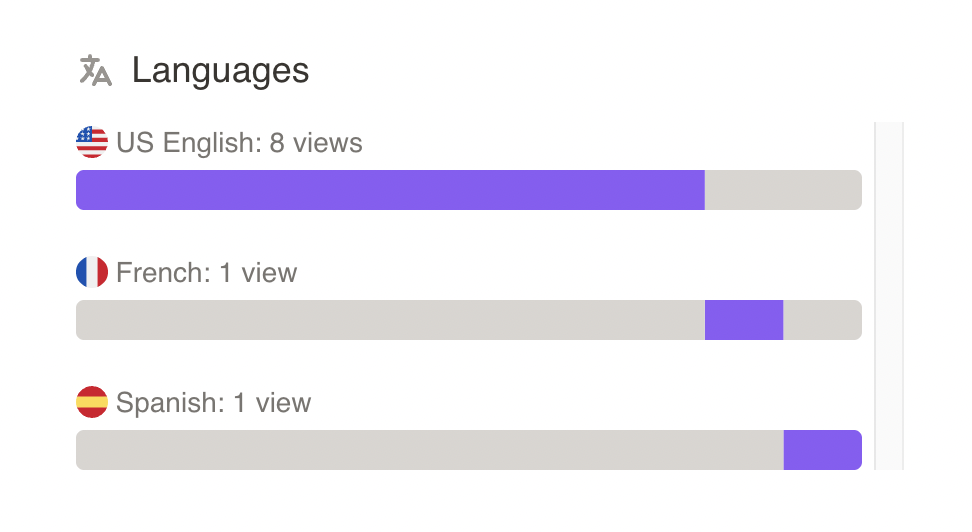
Languages
See which languages your audiences are viewing your presentations in.