Waterfall
A waterfall slide visually illustrates how a starting value changes to a final value through a series of additions and subtractions. It is perfect for sharing NRR, perhaps with partners.
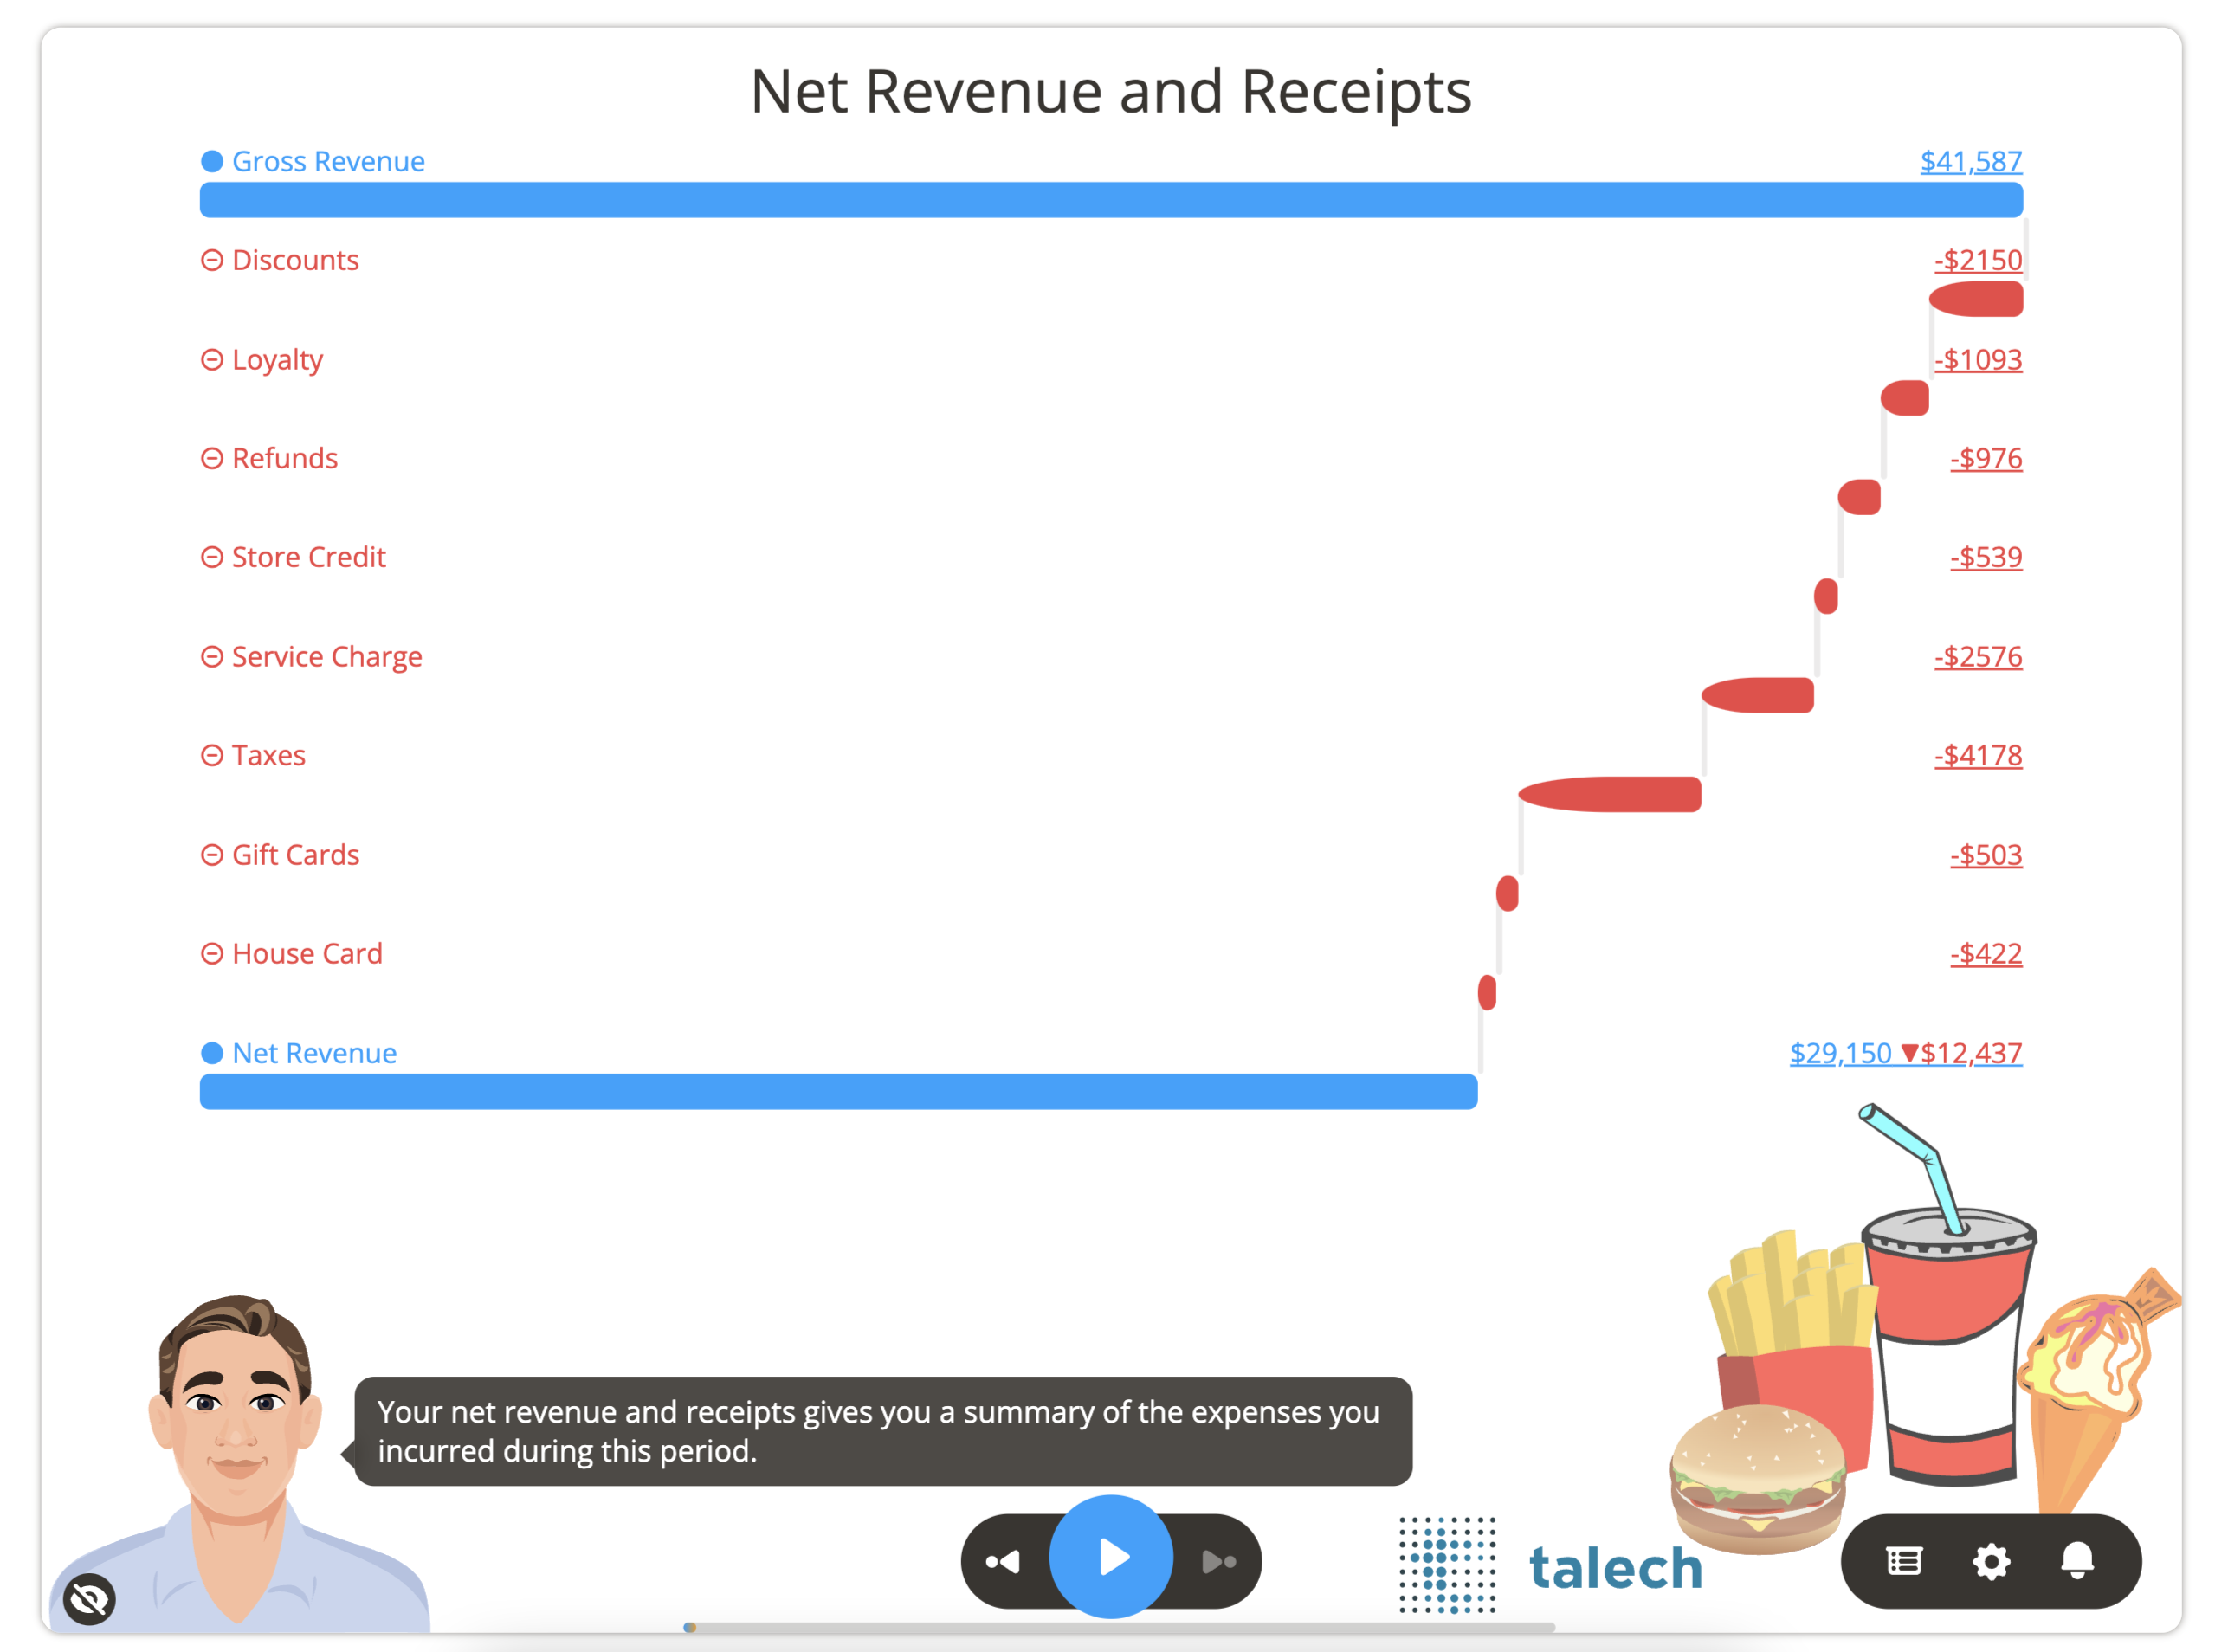
Here is some of the data that is used to generate the chart above for account 123954. You will need to format your data similar to the sample datasets for each slide type.
Note: The last value for Net Revenue is intentionally made to be zero. Cast automatically calculates this value as the first value (Gross Revenue) +/- the subsequent values in the data.
| ACCOUNTID | CATEGORY | VALUE |
|---|---|---|
| 123954 | Gross Revenue | 41587 |
| 123954 | Discounts | -2150 |
| 123954 | Loyalty | -1093 |
| 123954 | Refunds | -976 |
| 123954 | Store Credit | -539 |
| 123954 | Service Charge | -2576 |
| 123954 | Taxes | -4178 |
| 123954 | Gift Cards | -503 |
| 123954 | House Card | -422 |
| 123954 | Net Revenue | 0 |
Download Sample Data - Waterfall
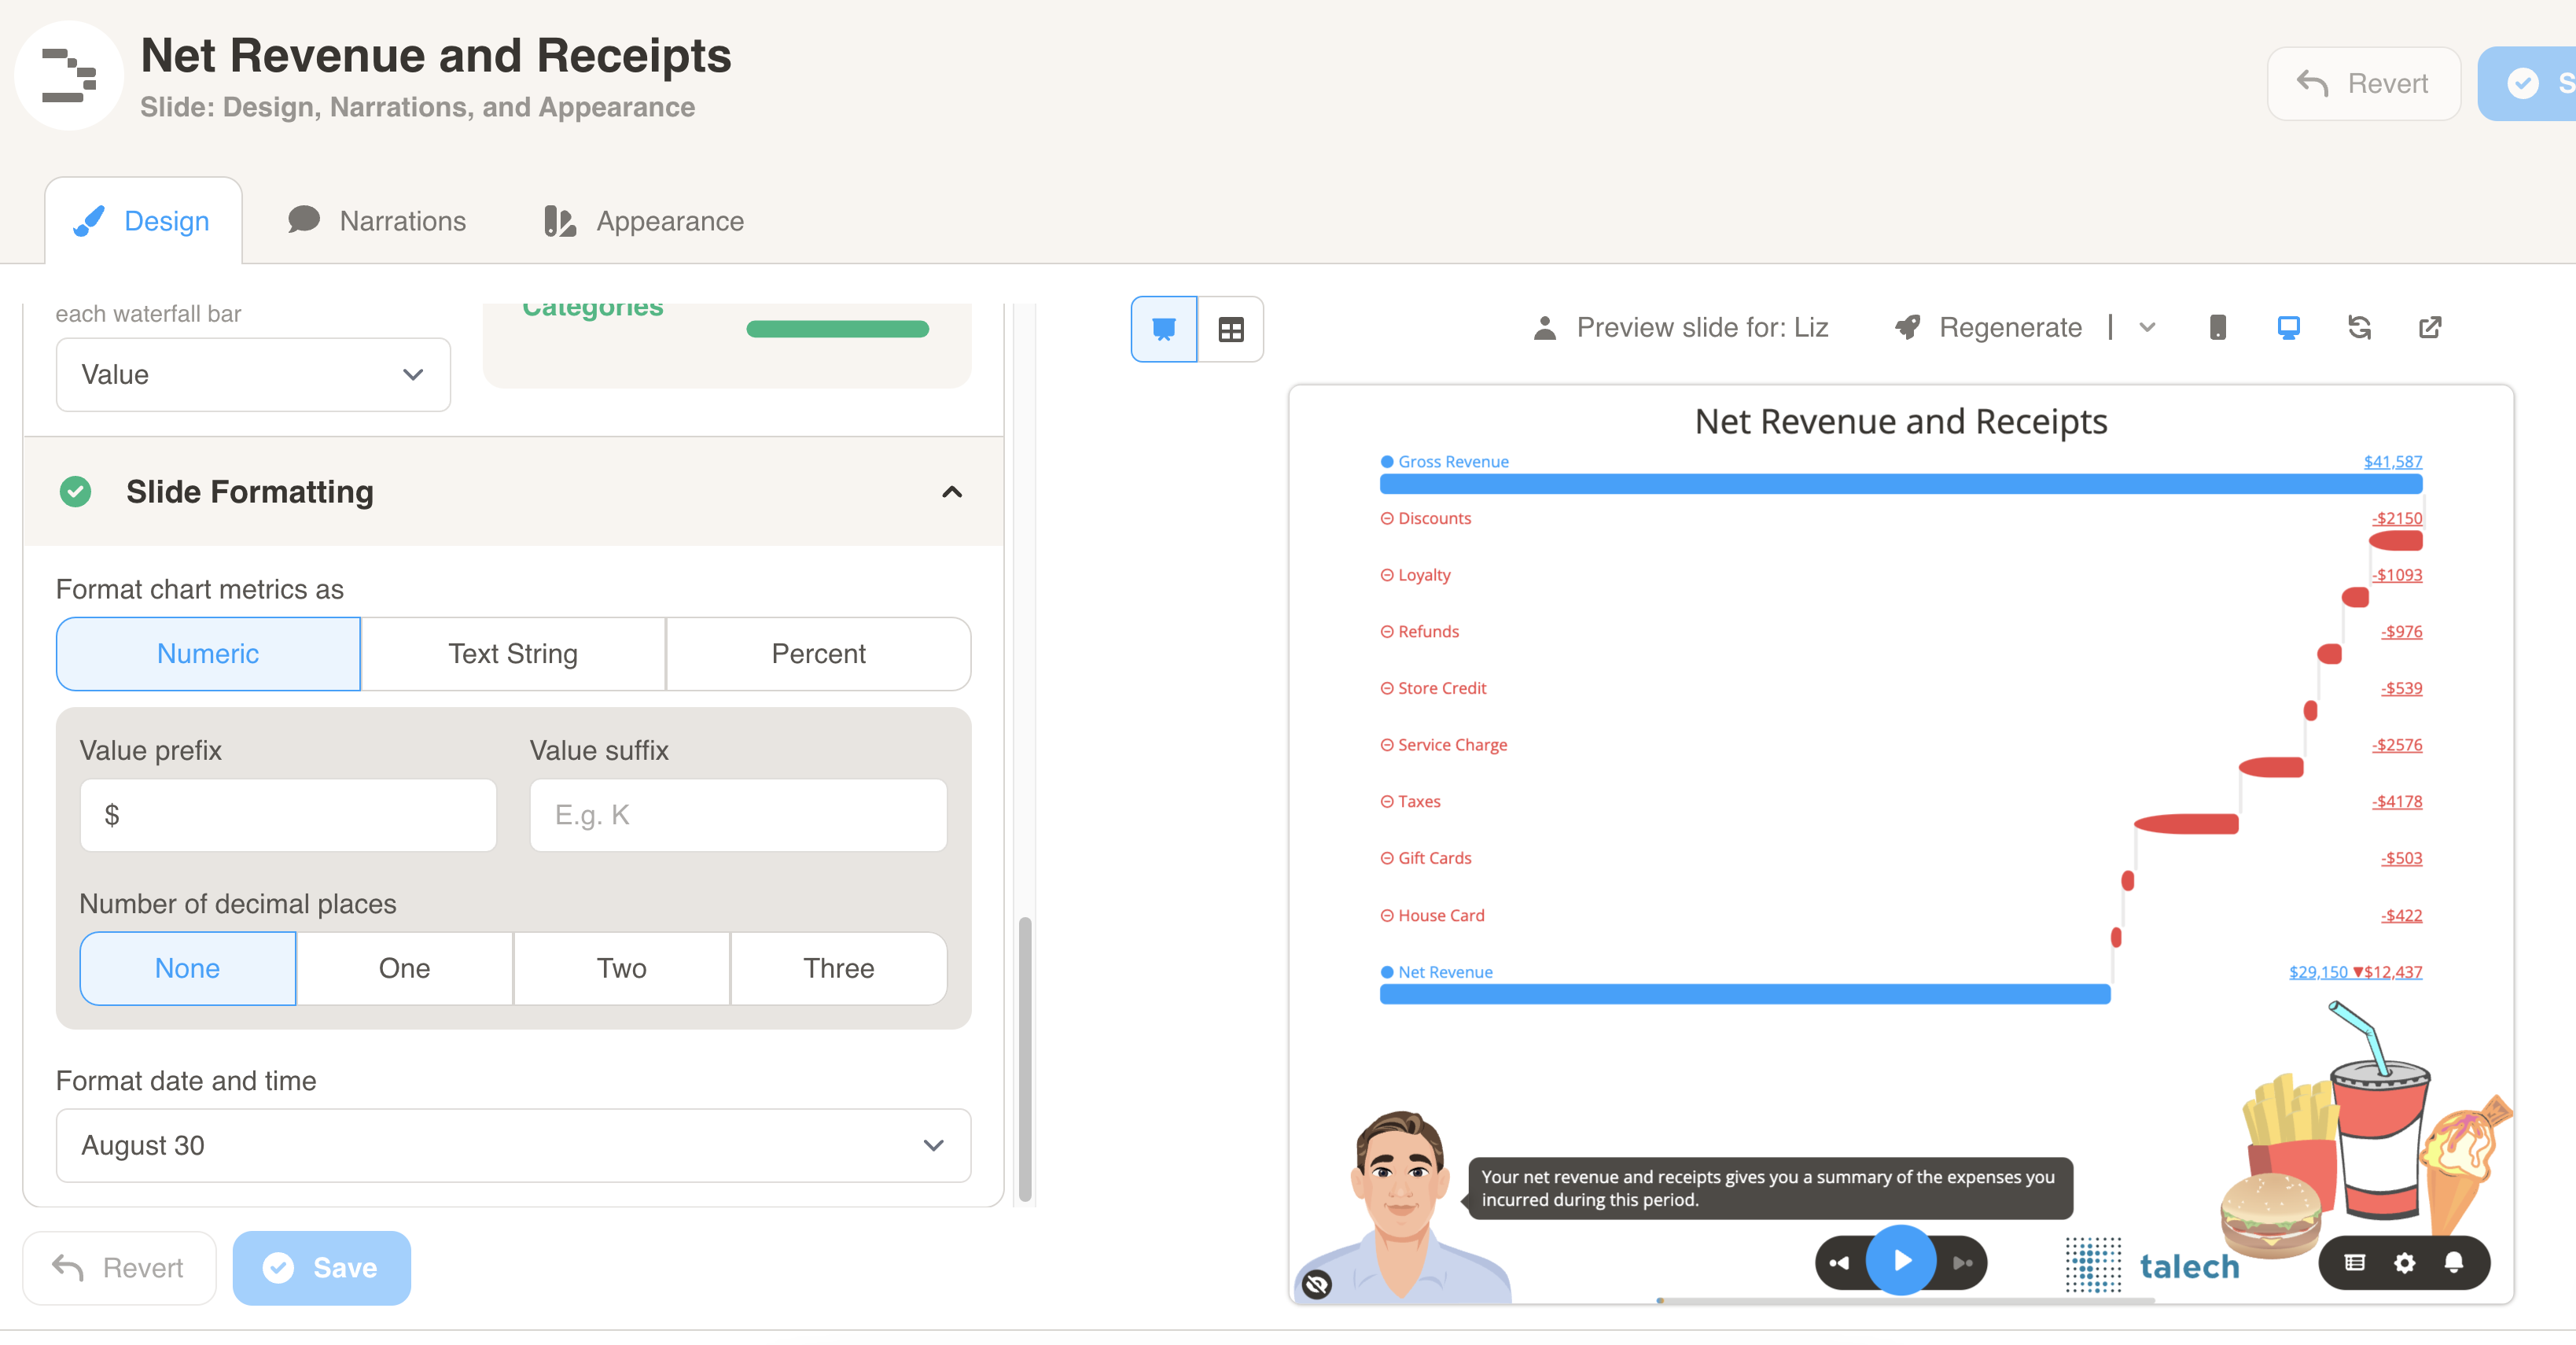
You can format the chart under Design. First, select your dataset from the dropdown menu.
Then, define the chart metrics for your slide. Pick the Waterfall Labels and Value from your dataset columns. The Waterfall Labels should be from a column with unique rows.
In this example, the CATEGORY column is used for Waterfall Labels. Each Category has its own VALUE.
Finally, choose Slide Formatting for your metrics values. Here we add the $ symbol as a prefix before the bar values to denote currency.