Line and Area Chart
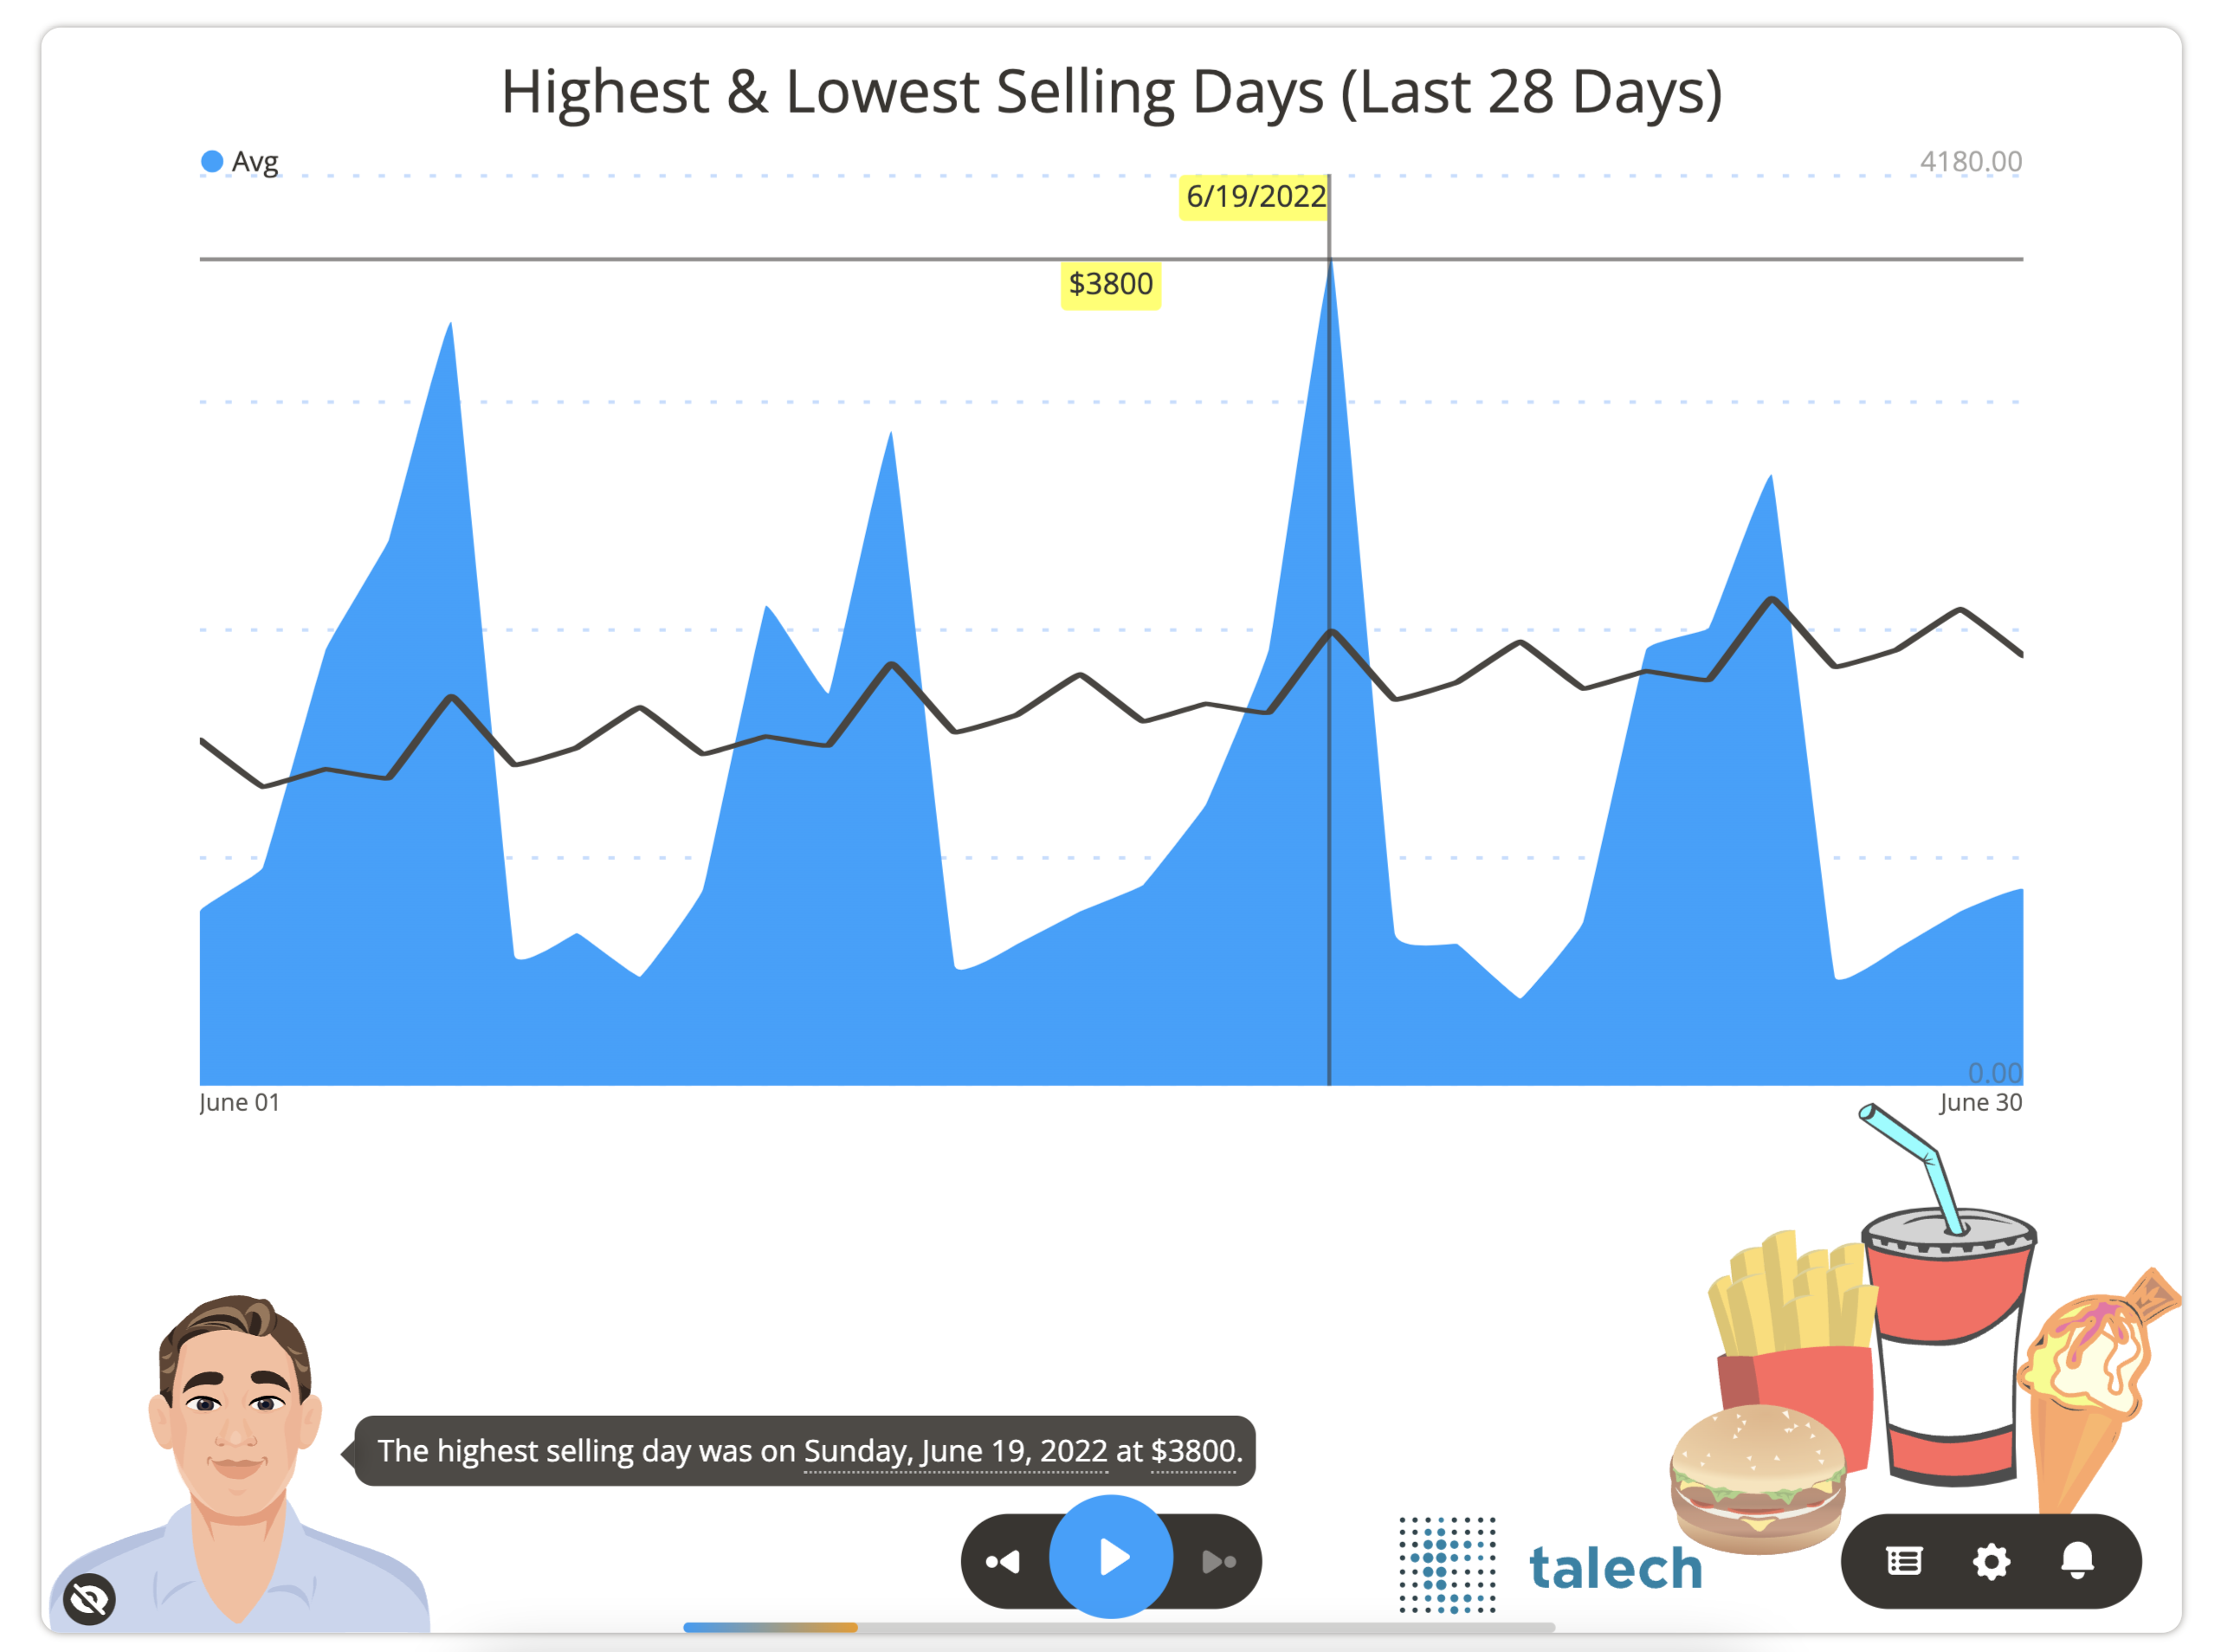
A line and area slide presents change in one or more metrics over time. The slide may show several groups of area/line charts on the same slide.
Here is some of the data that is used to generate the chart above for account 123954. You will need to format your data similar to the sample datasets for each slide type.
| ACCOUNTID | DATE | TYPE | DAYVALUE | VALUE |
|---|---|---|---|---|
| 123954 | 2022-06-01 0:00:00 | Day | Wednesday | 800 |
| 123954 | 2022-06-02 0:00:00 | Day | Thursday | 1000 |
| 123954 | 2022-06-03 0:00:00 | Day | Friday | 2000 |
| 123954 | 2022-06-04 0:00:00 | Day | Saturday | 2500 |
| 123954 | 2022-06-05 0:00:00 | Day | Sunday | 3500 |
| 123954 | 2022-06-06 0:00:00 | Day | Monday | 600 |
| 123954 | 2022-06-07 0:00:00 | Day | Tuesday | 700 |
| 123954 | 2022-06-08 0:00:00 | Day | Wednesday | 500 |
| 123954 | 2022-06-09 0:00:00 | Day | Thursday | 900 |
| 123954 | 2022-06-10 0:00:00 | Avg | 1585.71 | |
| 123954 | 2022-06-11 0:00:00 | Avg | 1371.43 | |
| 123954 | 2022-06-12 0:00:00 | Avg | 1451.43 | |
| 123954 | 2022-06-13 0:00:00 | Avg | 1411.43 | |
| 123954 | 2022-06-14 0:00:00 | Avg | 1785.71 |
Download Sample Data - Line and Area
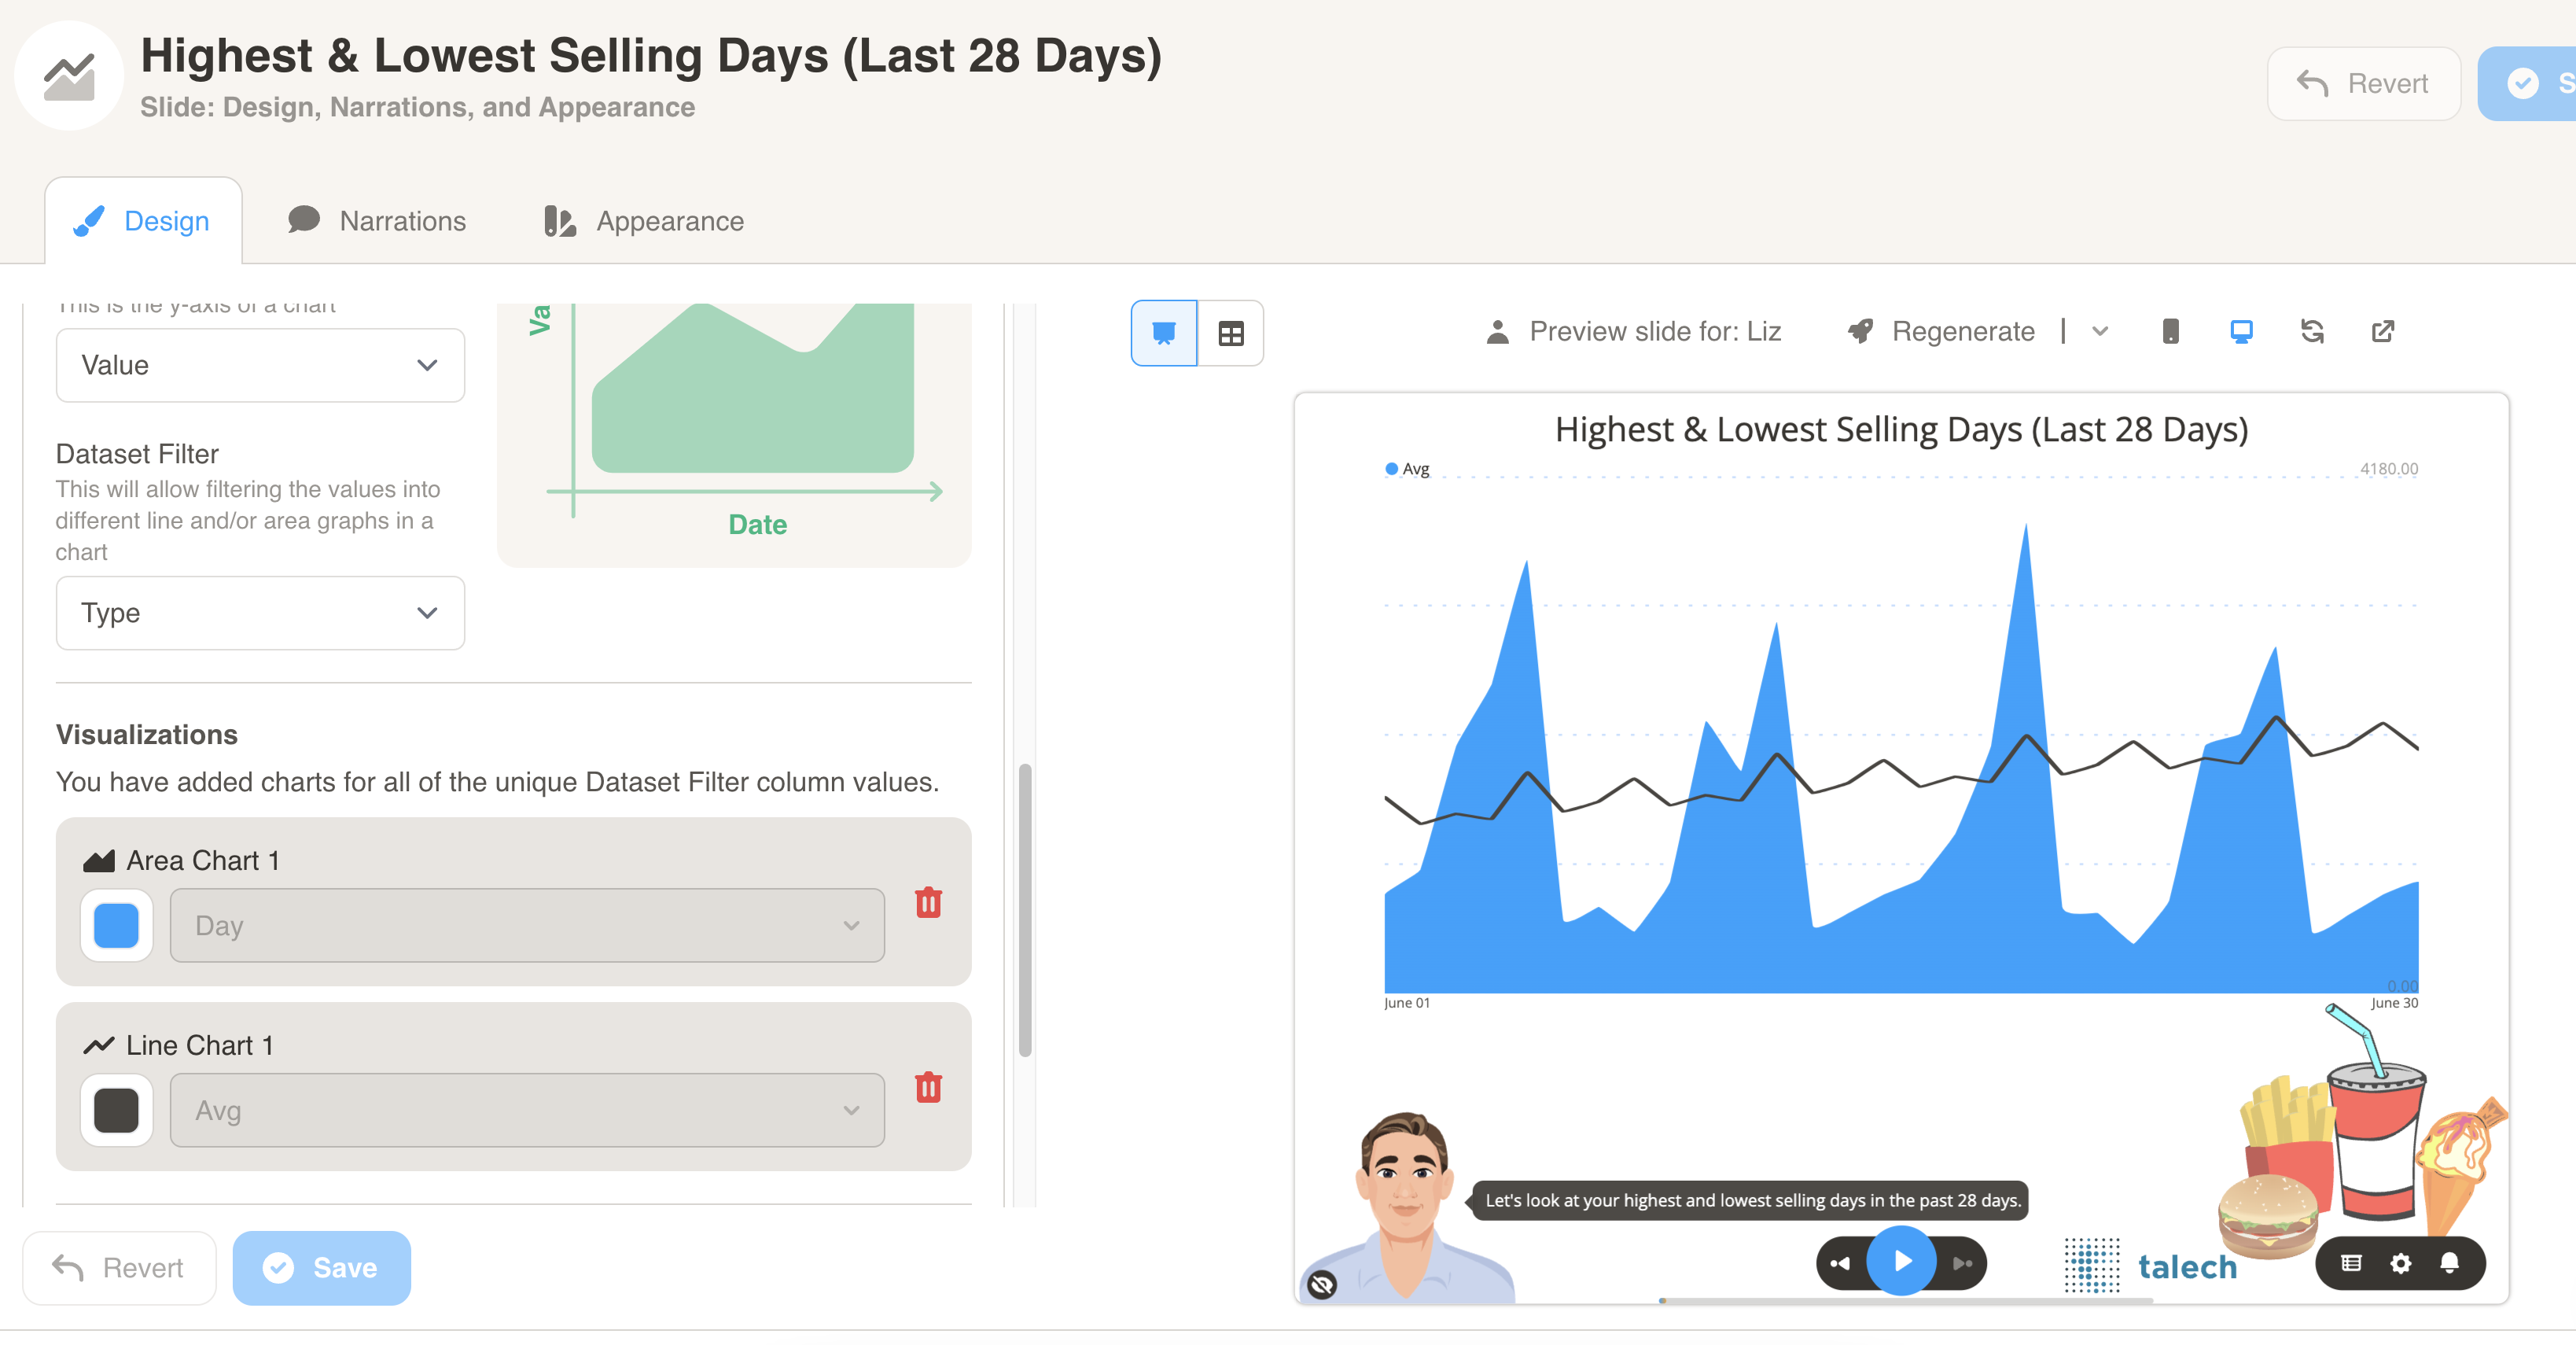
You can format the chart under Design. First, select your dataset from the dropdown menu.
Then, define the chart metrics for your slide. Pick the Horizontal Axis, Vertical Axis and Dataset Filter from your dataset columns. The Dataset Filter is typically the type of values in your data.
In this example, the TYPE column is used as as a Dataset Filter. There are two types of values, Day and Avg.
Finally, select a Dataset Filter value from the dropdown and press the Add Chart button. Here, we create an area chart for Day and a line chart for Avg.
Press the Save button to view your changes.