Slide Types
Cast supports four types of slides:
- Editorials,
- Data-driven charts,
- Navigation (drill-down or menu), and
- data-driven Widgets.
Slides are grouped under a project and are conditionally shown to each user enabling personalization.

Editorials
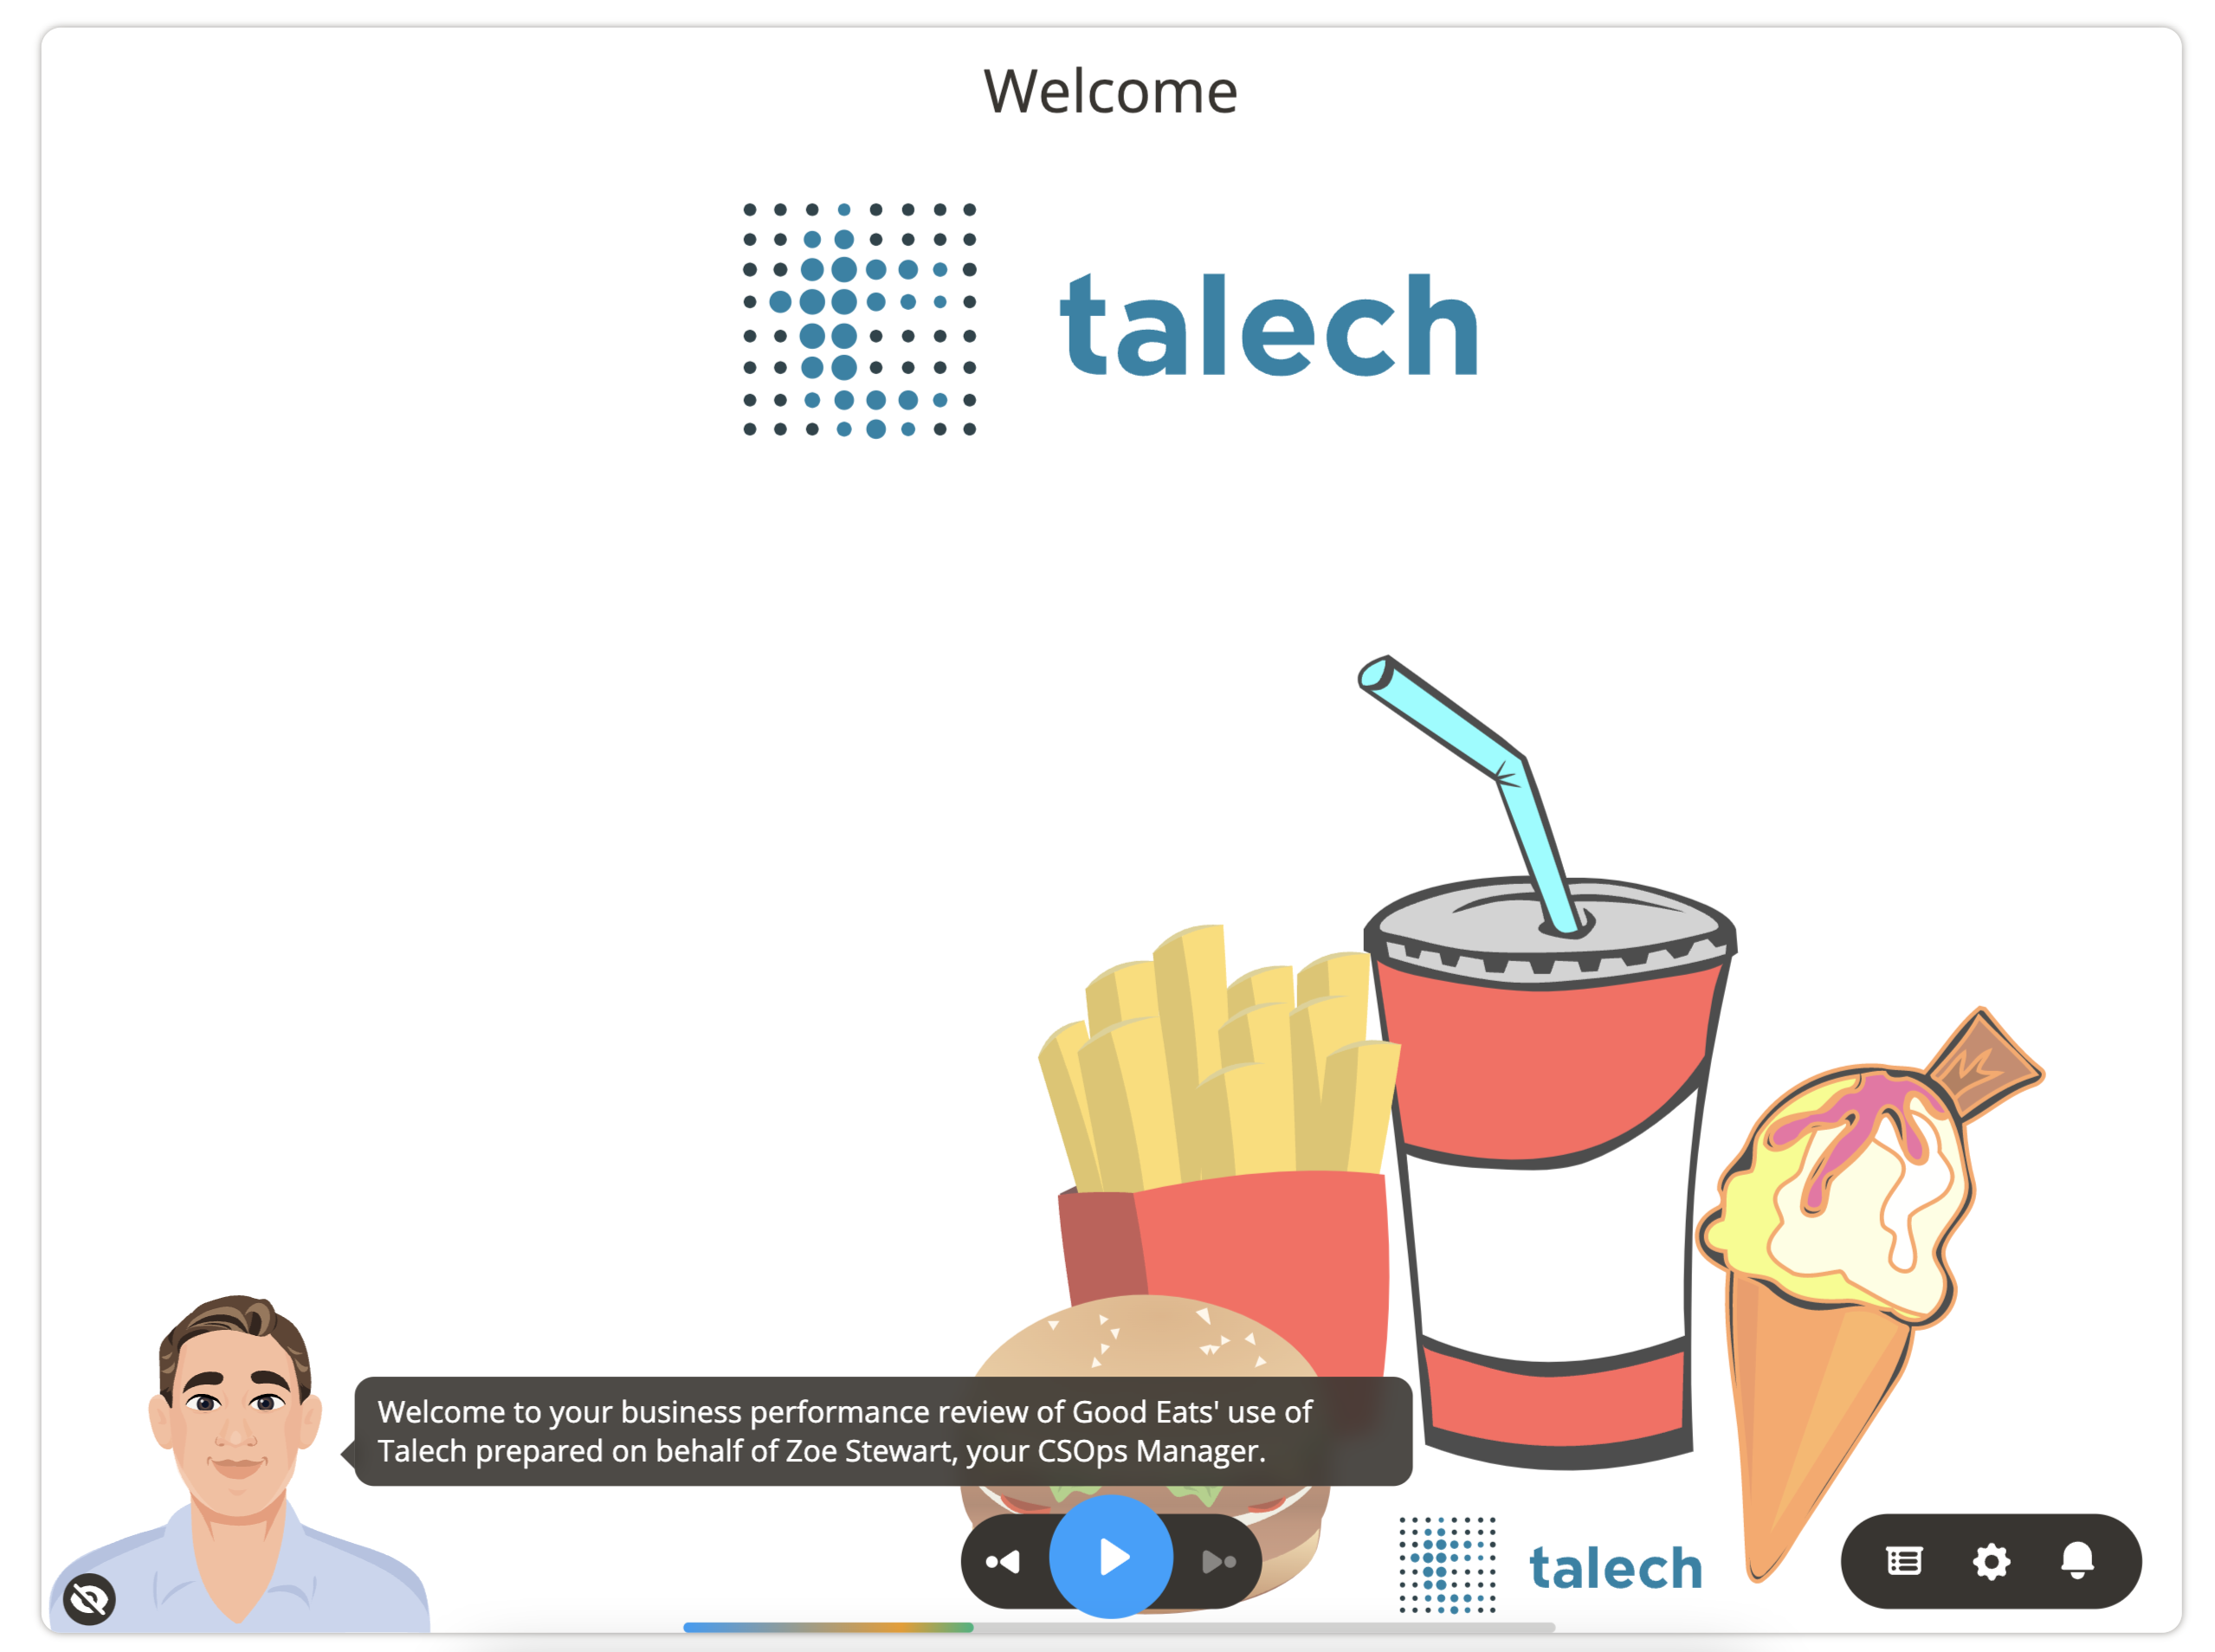
Editorials are non-data driven and include:
- Non-data driven Checklists and Agenda
- Feature announcements
- General recommendations
- How-Tos
- Thank you slides
- Video slides
- Welcome and introduction slides
Charts
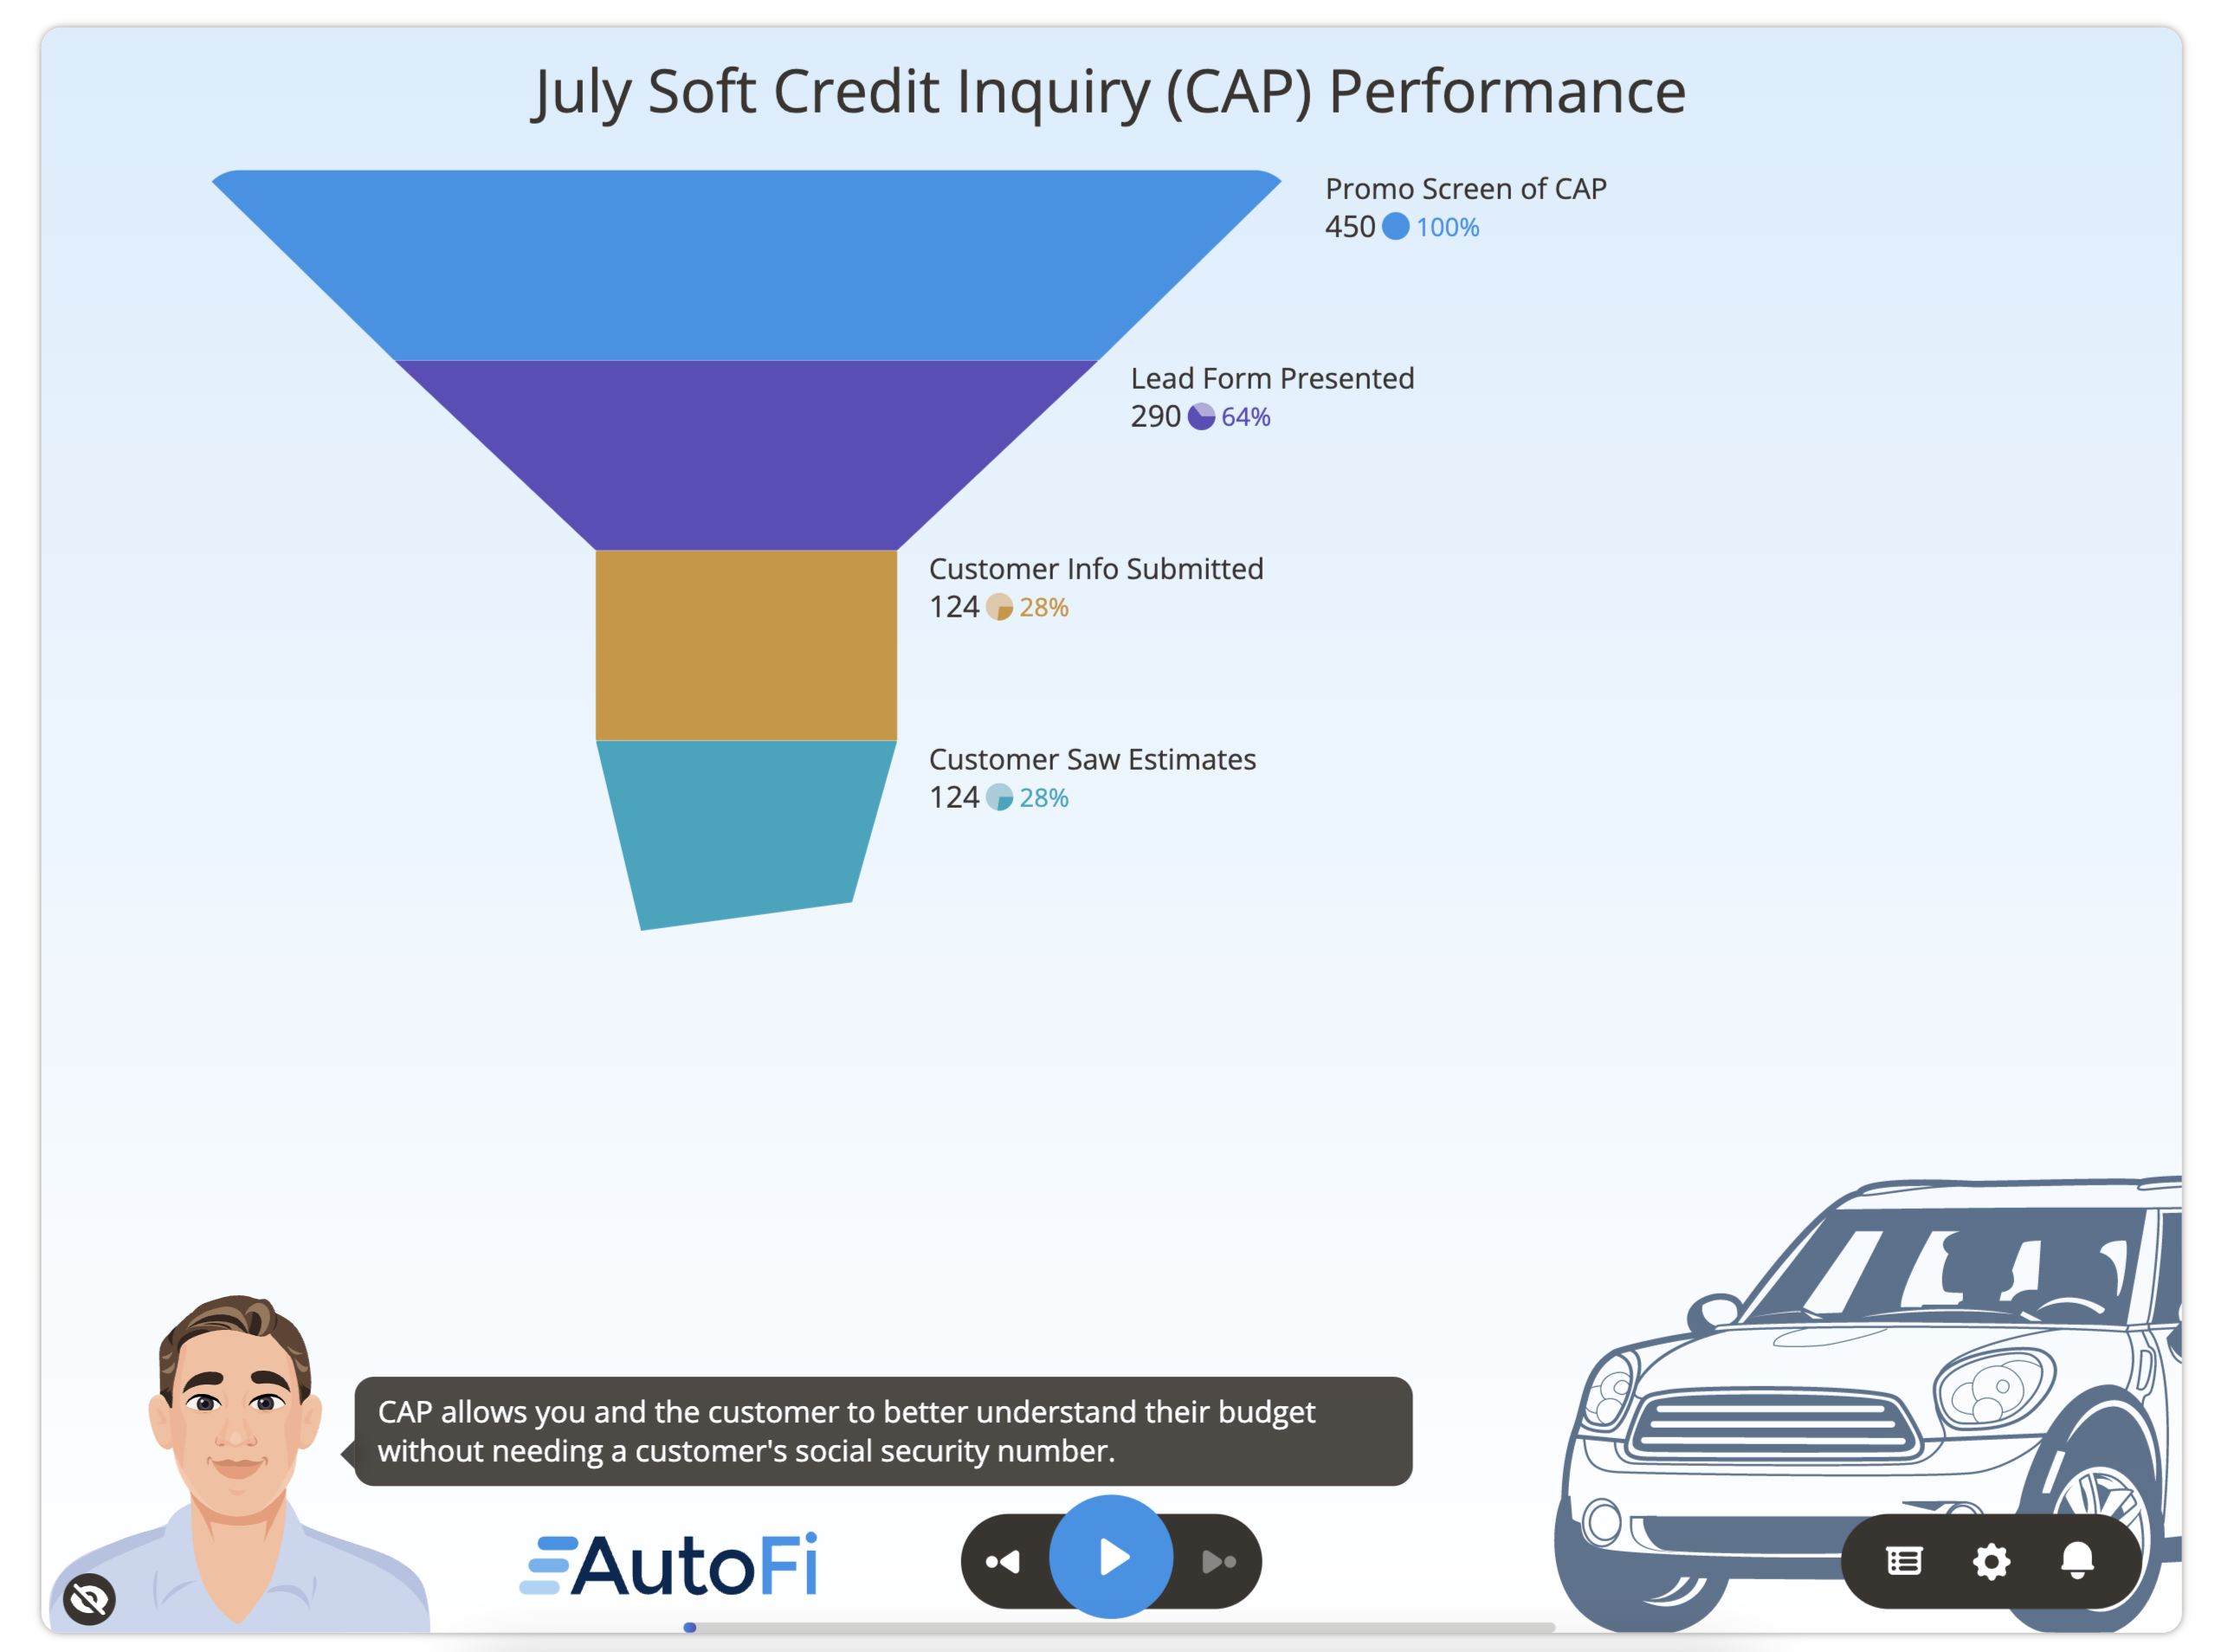
Data-driven charts include:
- Categorization or Pie Bars
- Checklists and Agenda
- Compare Bar charts
- Funnel
- Gauges
- Grouped Bar Chart
- Infographic
- Line and Area Charts
- Single Bar Chart
- Stacked Bars
- Towers of Hanoi
- Waterfall
Navigation
A navigation slide lets the viewer of your presentations choose what they want to see next. An executive may be interested in overall summary and one or two details. An operator may want to see everything.
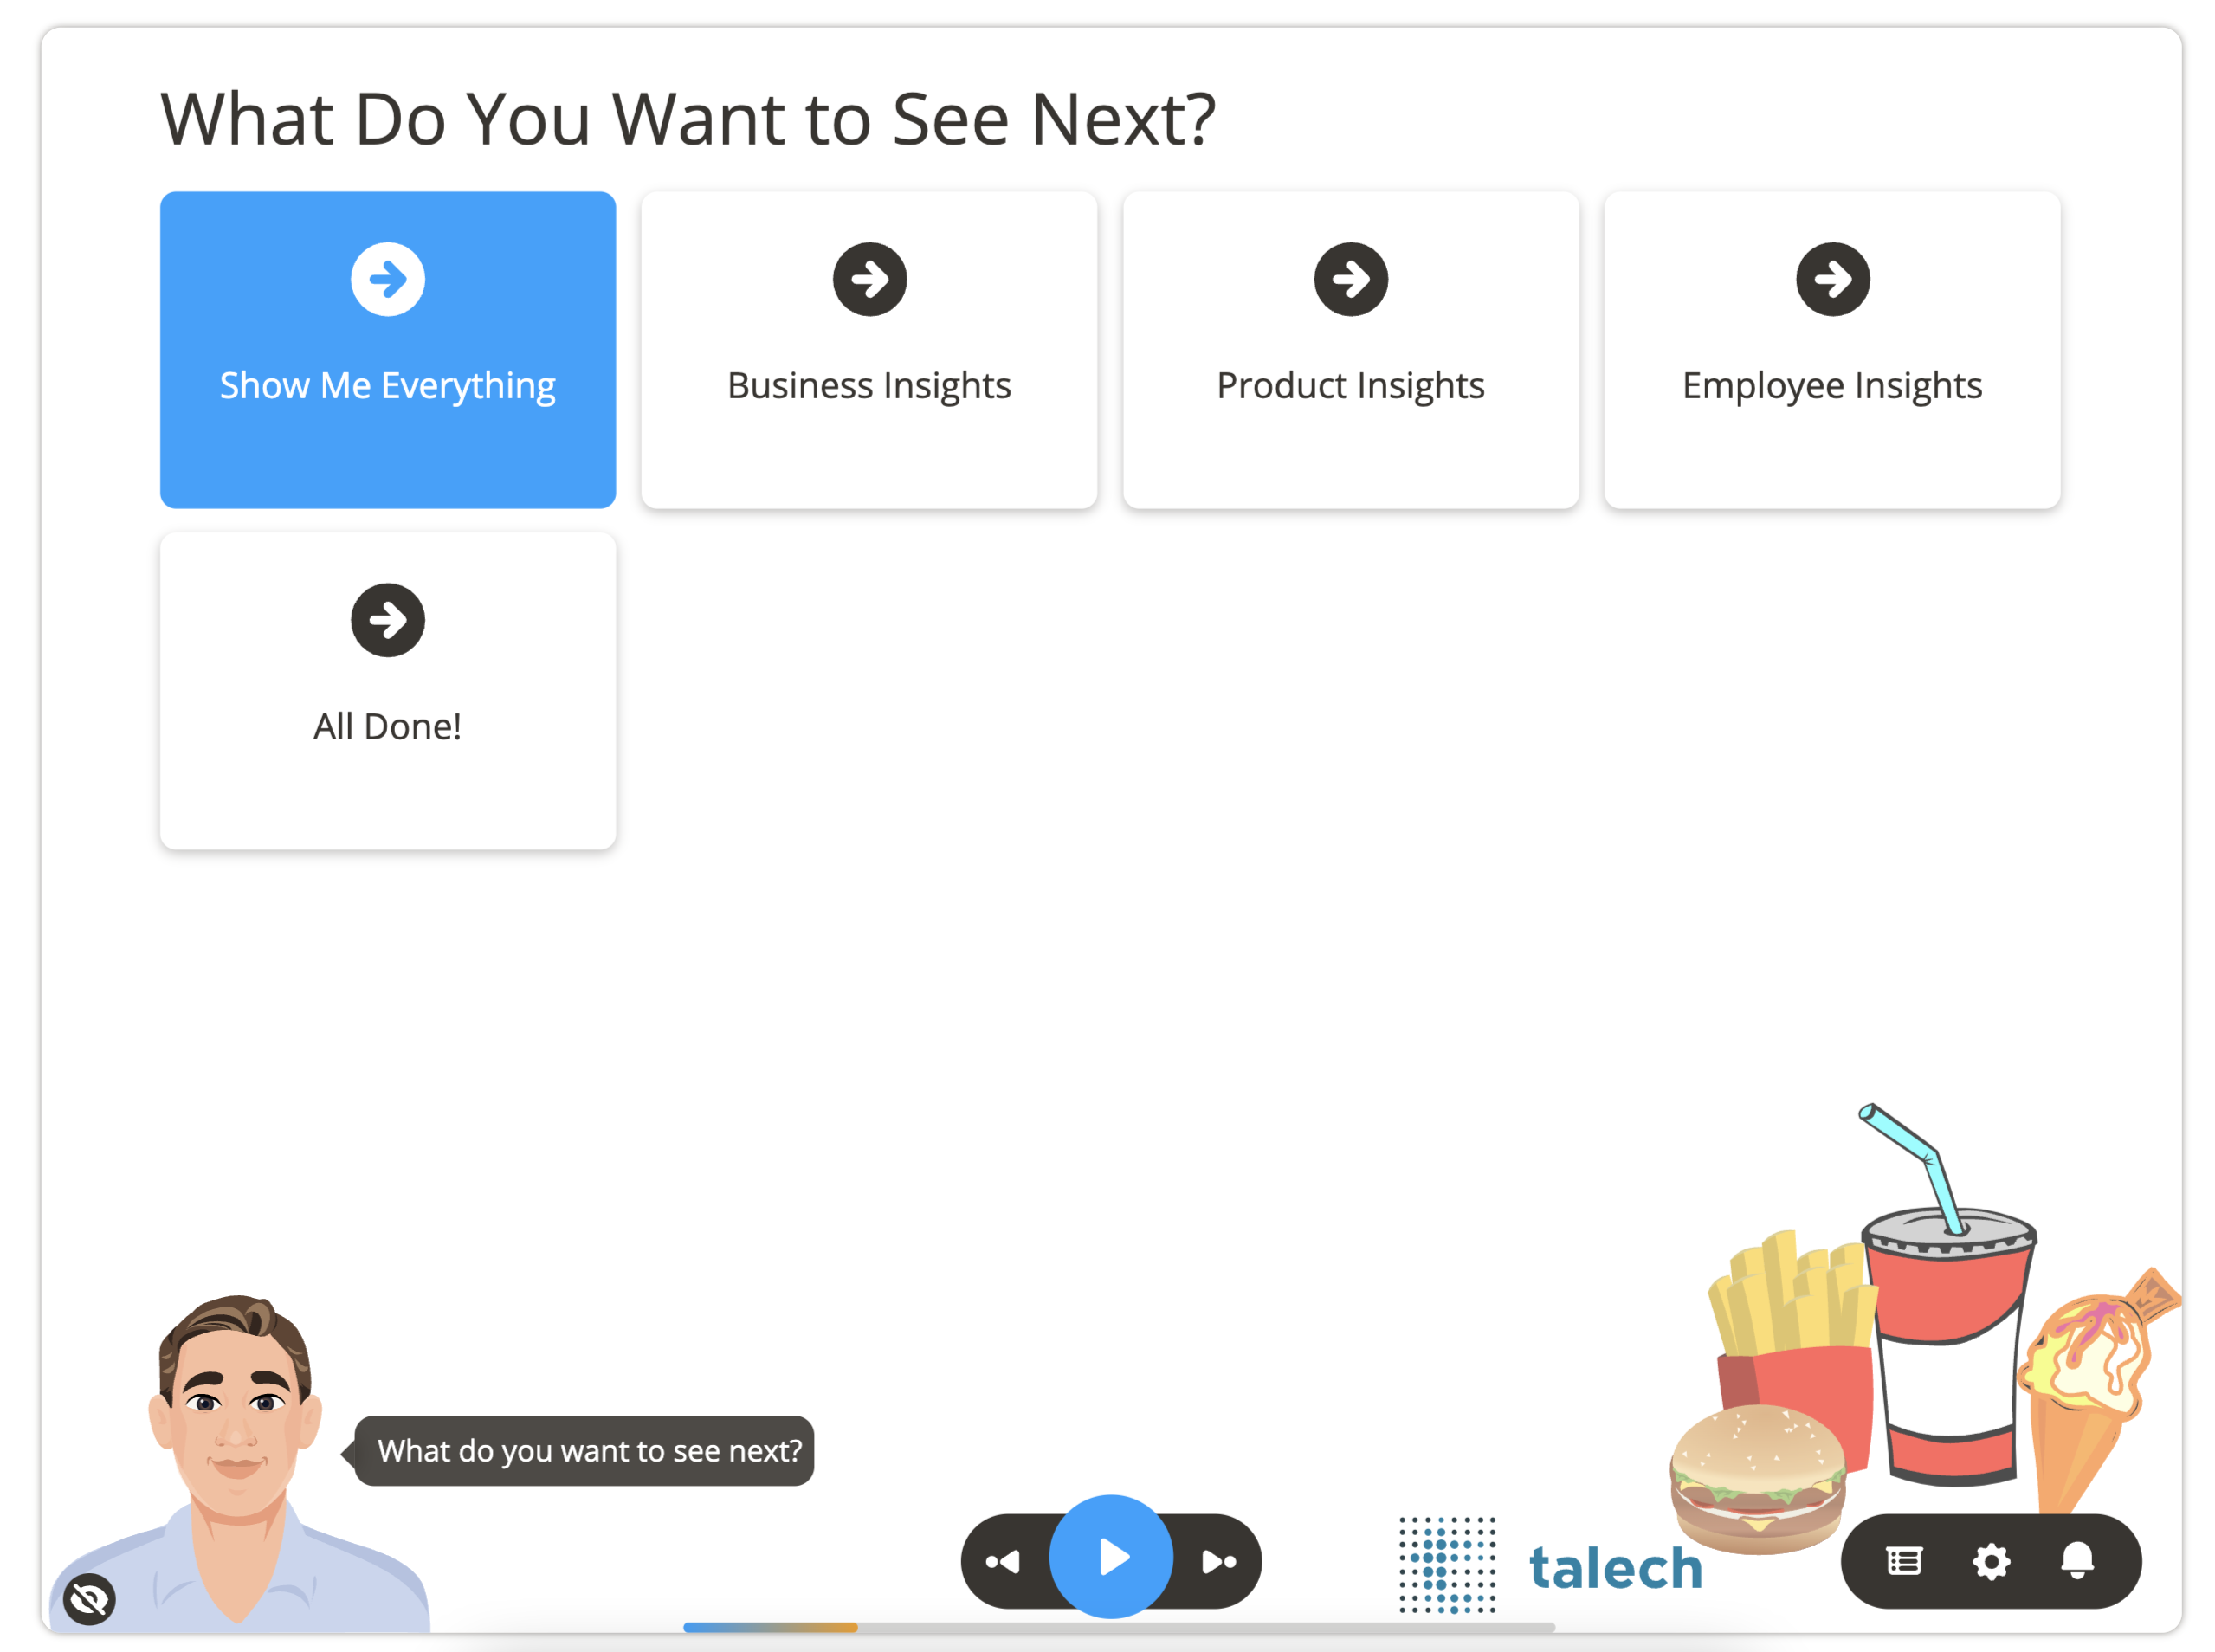
- Drilldowns: Your customers can chose their journey or can drill-down into areas of specific interest.
- Summary vs. Detailed versions of presentations: You can show a shorter vs. detailed version of the presentation.
- Sequences of slides vs. Show me everything: You can show a shorter vs. detailed version of the presentation.
- Advocacy
- Overall Satisfaction
- Customer Satisfaction
- NPS, CES, EGR (NPS 3.0)
- Referrals
Widgets
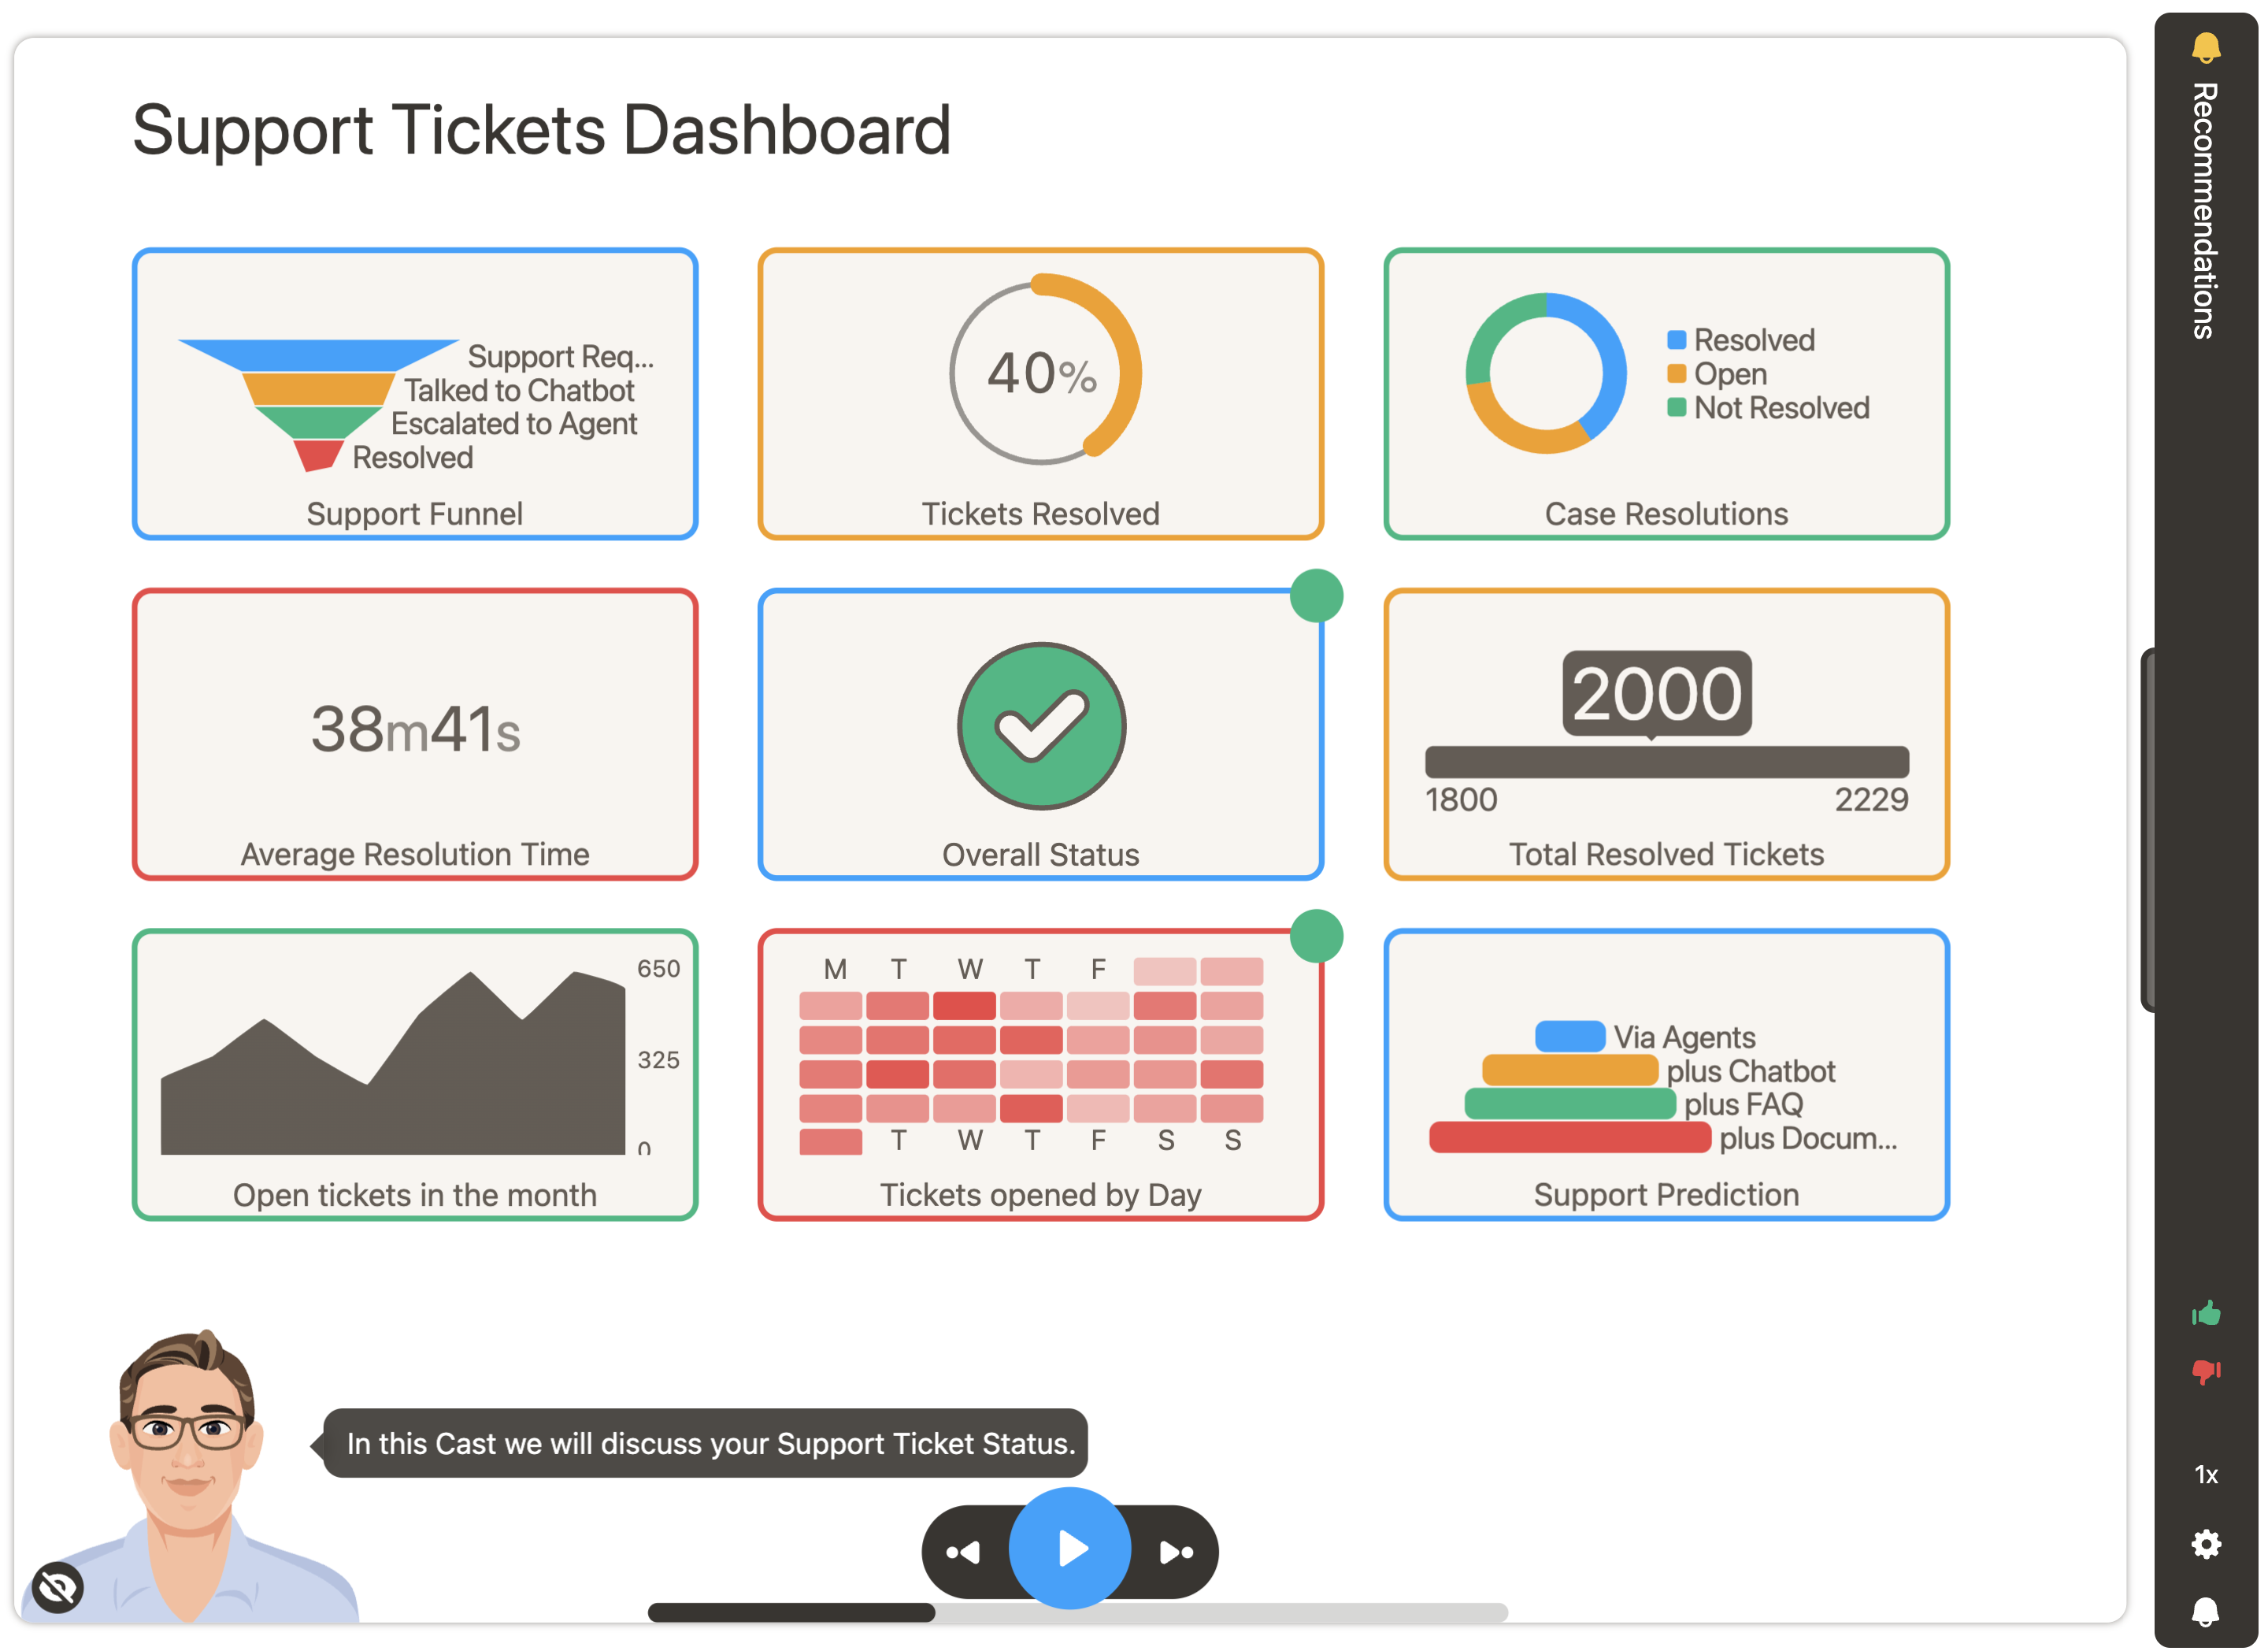
Data-driven widgets slide shows various performance indicators metrics and charts in a single slide. Widgets of following types are supported:
- Bars - Compare multiple values in the slide as bars.
- Date time - Display a date as a value in the slide.
- Days of a Month - Display a calendar heatmap.
- Days of week - Display a circular bar chart with days represented by a bar.
- Doughnut - Display multiple values together as a Doughnut or a hollow pie chart.
- Funnel and Towers of Hanoi - Display values across process stages.
- Hours of a Day - Display a circular bar chart with hours represented by a bar.
- Label - Display text values in the slide.
- Number - Display numeric values in the slide.
- Percent - Display a percentage based on the values in the slide.
- Pie - Display multiple values together as a pie chart.
- Piebar - Display different values as part of a total, similar to a pie chart showing even the smallest slivers of data.
- Progress - Display the progress made towards a goal, between a starting value and ending value.
- Sparkarea - Display a change in values over time as a spark area.
- Sparkbar - Display a change in values over time as a spark bar.
- Sparkline - Display a change in values over time as a spark line.
- Status - Display a status icon based on the value in the slide.
- Time range - Display a formatted length of time as a value in the slide.