Funnel, Towers of Hanoi
A funnel slide represents historical values across process stages. A Towers-of-Hanoi chart, an upside-down funnel, is typically forward-looking and shows numbers to achieve a top-level goal.
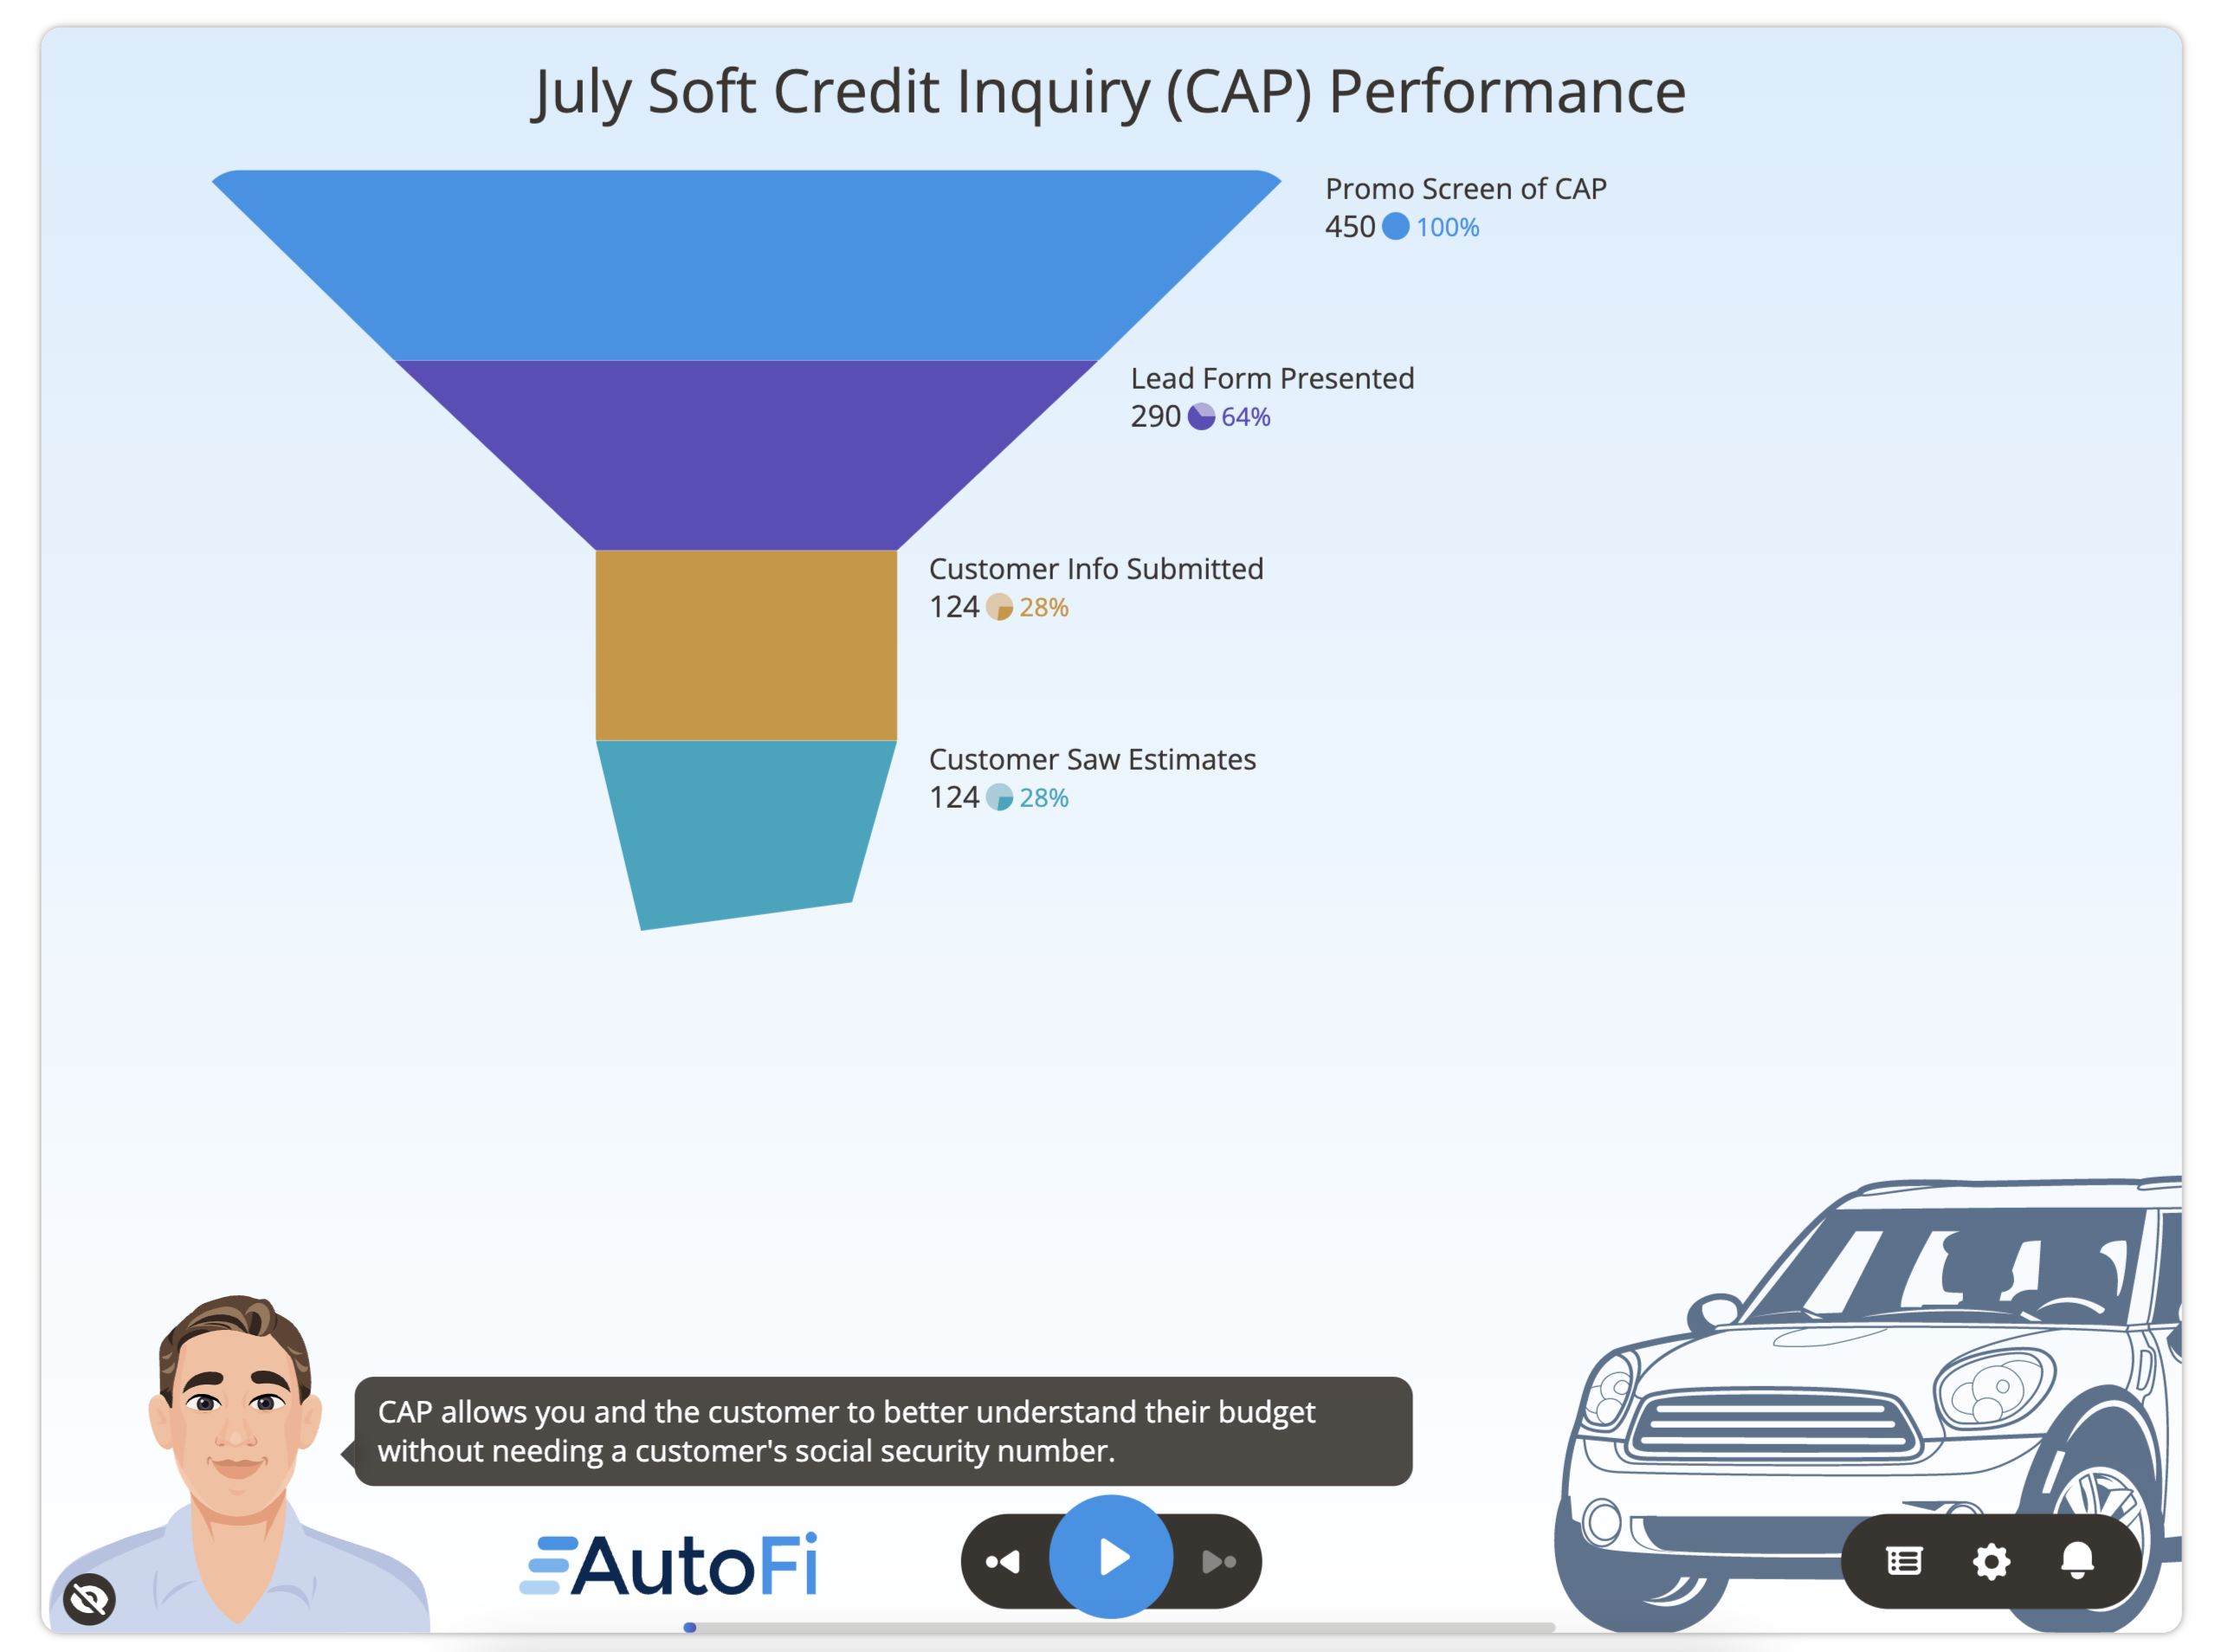
Here is some of the data that is used to generate the chart above for account 123954. You will need to format your data similar to the sample datasets for each slide type.
Note: The value column must be in descending order to display correctly.
| ACCOUNTID | METRIC | VALUE |
|---|---|---|
| 123954 | Promo Screen of CAP | 450 |
| 123954 | Lead Form Presented | 290 |
| 123954 | Customer Info Submitted | 124 |
| 123954 | Customer Saw Estimates | 124 |
You can format the chart under Design. First, select your dataset from the dropdown menu.
Then, define the chart metrics for your slide. Pick the Category Labels and Value.
In this example, the Metric column is used for Category Labels. The Value column is being used for Value.
Finally, choose Slide Formatting for your metrics values. Here we formatted the chart metrics numeric.
Additionally, you can change the look-and-feel of the chart under Appearance. Here we added a background image for both the desktop and mobile view.